Shopping Tracker
Track how your products appear in AI-powered shopping recommendations — and outpace the competition.
1. Overview
The Shopping & Ads Tracker is payritesonic GEO’s dedicated module for monitoring your ecommerce product visibility inside AI-generated shopping responses — starting with ChatGPT’s agentic commerce experience. As AI platforms increasingly power product discovery and purchase decisions, this feature gives D2C brands, ecommerce retailers, and agencies the intelligence to understand, benchmark, and improve how their products are surfaced by AI engines.
Who is this for?
- D2C brands — Track whether your own products appear when consumers ask AI for buying recommendations.
- Ecommerce platforms & retailers — Monitor how your catalog performs across AI-driven shopping experiences versus competitors.
- Agencies & performance marketers — Report on AI shopping share of voice for client brands and optimize product visibility accordingly.
Why This Matters: The Rise of Agentic Commerce
ChatGPT introduced agentic commerce — AI agents that don’t just answer shopping queries but actively recommend products with buy links, prices, and merchant details. This is a fundamental shift in how consumers discover and purchase products. If your products aren’t visible in AI shopping responses, you’re losing consideration before a potential customer ever visits your website.
2. Overview Page
The Overview page provides a high-level dashboard of your brand’s shopping performance in AI responses. It is organized into two tabs: General (your own performance) and Competitors (how you stack up against rivals).
2.1 Filters & Date Range
Filters at the top of the page apply across all data on both tabs. Use them to refine your analysis:
- Date range — Set and compare time periods to track trends and measure growth.
- Markets — Filter by geographic market or region.
- Topic — Narrow results to a specific product category or shopping topic.
- Products — Focus on a specific product or product line.
- Prompt type — Filter based on the type of consumer query that triggered the AI shopping response.
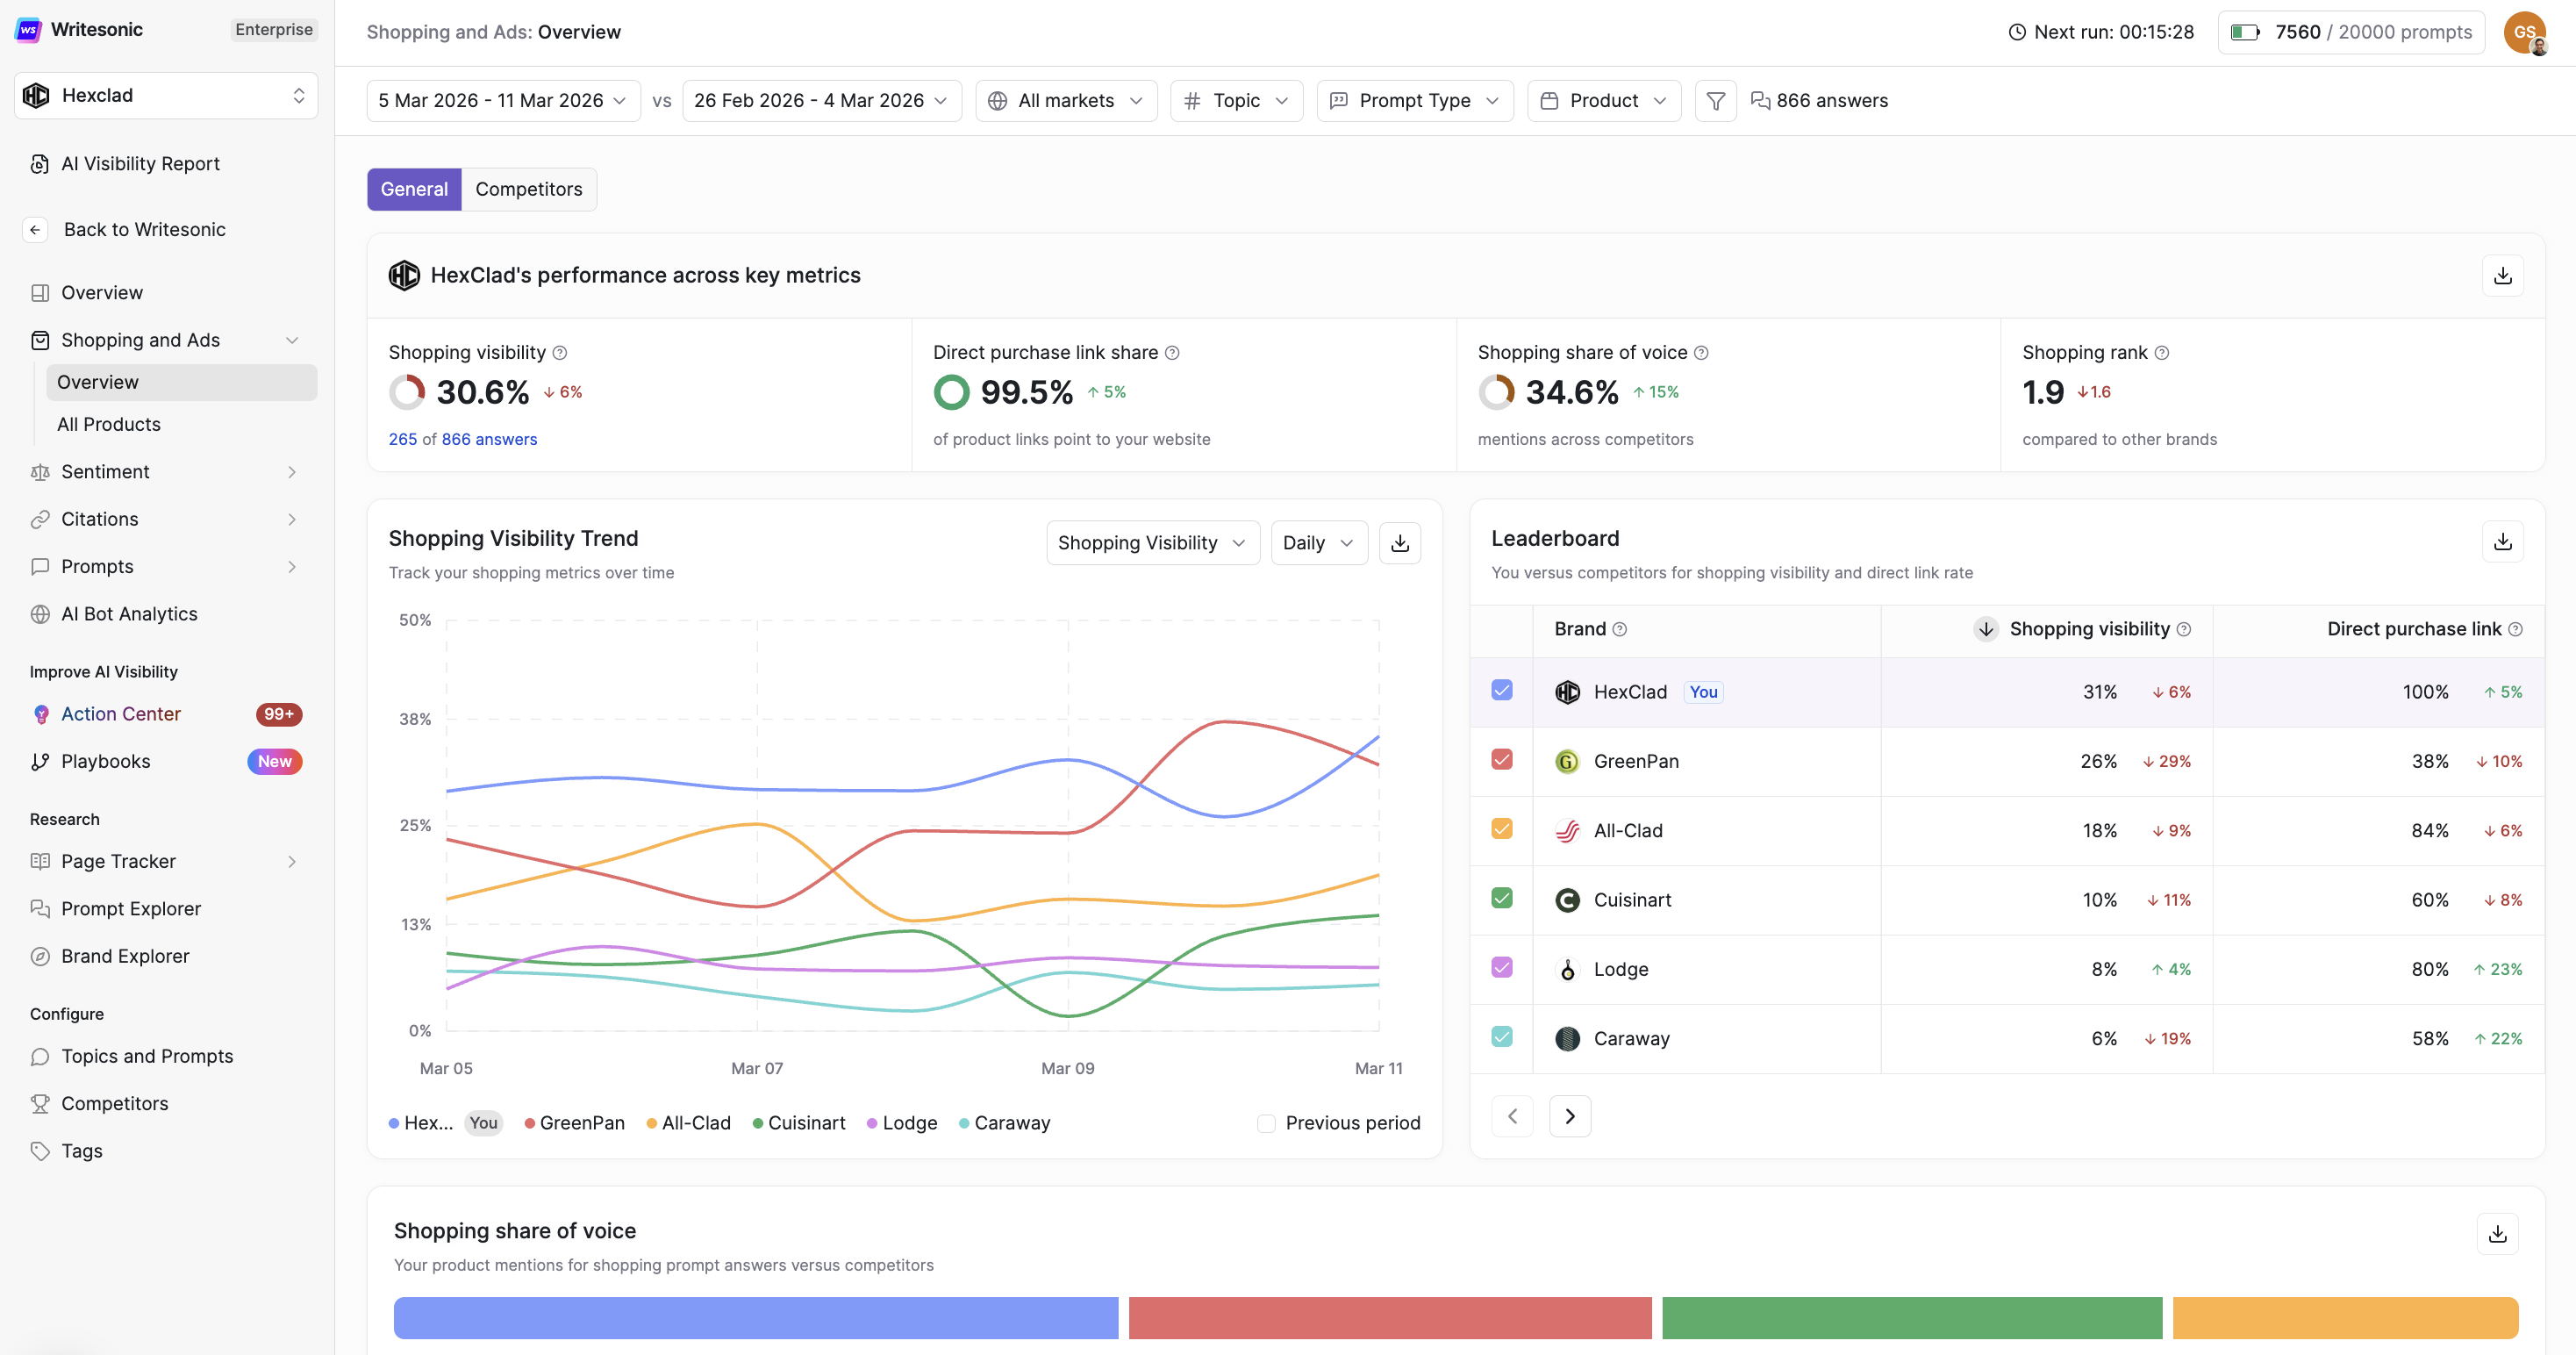
2.2 General Tab — Your Brand’s Performance
The General tab consolidates your brand’s AI shopping performance into four headline metrics, followed by detailed charts and breakdowns.
Key Performance Metrics
These four metrics appear at the top of the General tab as your primary performance indicators:
| Metric | What It Means |
|---|---|
| Shopping Visibility | How often your product is mentioned in AI shopping results, expressed as a percentage. Calculated as: (answers mentioning your product) ÷ (total answers that include shopping cards). A higher percentage means your products appear more consistently across AI shopping responses. |
| Direct Purchase Link Share | The share of shopping cards that link directly to your own website instead of a third-party retailer. Calculated as: (product links pointing to your site) ÷ (total product links across all shopping cards). Higher is better — it means customers can buy from you directly, giving you full margin and first-party data. |
| Shopping Share of Voice | Your brand’s share of shopping visibility relative to all competitors in the same category. Calculated as: (your shopping visibility) ÷ (total shopping visibility across all competing products) × 100. A higher share of voice means your brand is dominating the AI shopping conversation. |
| Shopping Rank | The average position of your product when shown in AI answers with shopping cards. Lower numbers mean higher placement — position 1 means your product appears first in the list. |
Direct Purchase Link Trend
A time-series chart tracking your Direct Purchase Link share over the selected date range, with a comparison to the previous period. Use this to:
- Understand whether AI shopping answers are increasingly or decreasingly routing buyers to your own website.
- Correlate changes in direct link share with pricing changes, merchant updates, or content optimizations.
- Compare two periods side-by-side to validate growth or diagnose drops.
Leaderboard
A ranked comparison table showing your brand vs. configured competitors across Shopping Visibility and Direct Purchase Link share. Each row displays the brand’s metric value along with a period-over-period change indicator (↑ increase / ↓ decrease). Use this to quickly identify which competitor brands are gaining or losing ground in AI shopping results.
Shopping Share of Voice
A visual bar chart breaking down how total shopping visibility is distributed across all brands in your competitive set. Each brand’s segment is color-coded, making it easy to see at a glance who owns the largest share of AI shopping real estate in your category. Particularly useful for:
- Executive-level reporting on competitive positioning.
- Identifying brands you’re gaining share against — and those gaining on you.
Top Products in the Market
A ranked table listing the top-performing individual products across all brands by Shopping Visibility and Direct Purchase Link share. Toggle between:
- All Brands — See which products across your competitive set are most visible to AI buyers.
- Your Brand — Isolate only your own products to identify your top and bottom performers.
Columns shown: Brand, Product name, Shopping Visibility, and Direct Purchase Link share — each with period-over-period change indicators.
Your Performance by Shopping Topics
A breakdown of your Shopping Visibility and Direct Purchase Link performance segmented by shopping topic (e.g., Running Shoes, Marathon Gear, Trail Running). This helps you:
- Identify which product categories are driving your strongest AI shopping presence.
- Spot underperforming categories where visibility could be improved through content or catalog work.
- Answers — The raw count of AI responses in each topic that included your products as shopping cards.
2.3 Competitors Tab — Competitive Benchmarking
The Competitors tab provides a structured view of how your AI shopping performance compares against rivals — helping you identify strategic opportunities and areas of risk.
Strongest & Weakest Competitor Highlights
Four highlight cards at the top of the tab summarize the competitive landscape:
- Strongest competitor (Shopping Visibility) — The rival brand with the highest overall shopping visibility in AI responses.
- Weakest competitor (Shopping Visibility) — The rival brand with the lowest shopping visibility, indicating potential opportunity to capture share.
- Strongest competitor (Direct Purchase Link) — The brand most effectively driving direct-to-site traffic through AI shopping cards.
- Weakest competitor (Direct Purchase Link) — The brand least effective at converting AI shopping presence into direct purchase traffic.
Shopping Performance by Brand
A comprehensive table comparing all tracked brands across:
- Products — Number of unique products this brand has appeared with in AI shopping results.
- Shopping Visibility — The brand’s overall shopping visibility percentage, with period-over-period change.
- Direct Purchase Link — The brand’s direct link share, with period-over-period change.
Paginate through all tracked brands and export data for offline reporting or client presentations.
Market Comparison Matrix
A cross-tabulation matrix that maps each brand’s performance across different shopping topics (e.g., Running Shoes, Budget Shoes, Marathon Gear). Easily identify:
- Topics where you are the clear market leader.
- Topics where a specific competitor dominates and you have ground to recover.
- White-space opportunities — topics with no clear leader, representing a chance to establish dominance.
Switch the matrix metric between Shopping Visibility and Direct Purchase Link using the dropdown selector.
Updated 4 months ago