Overview: Competitors
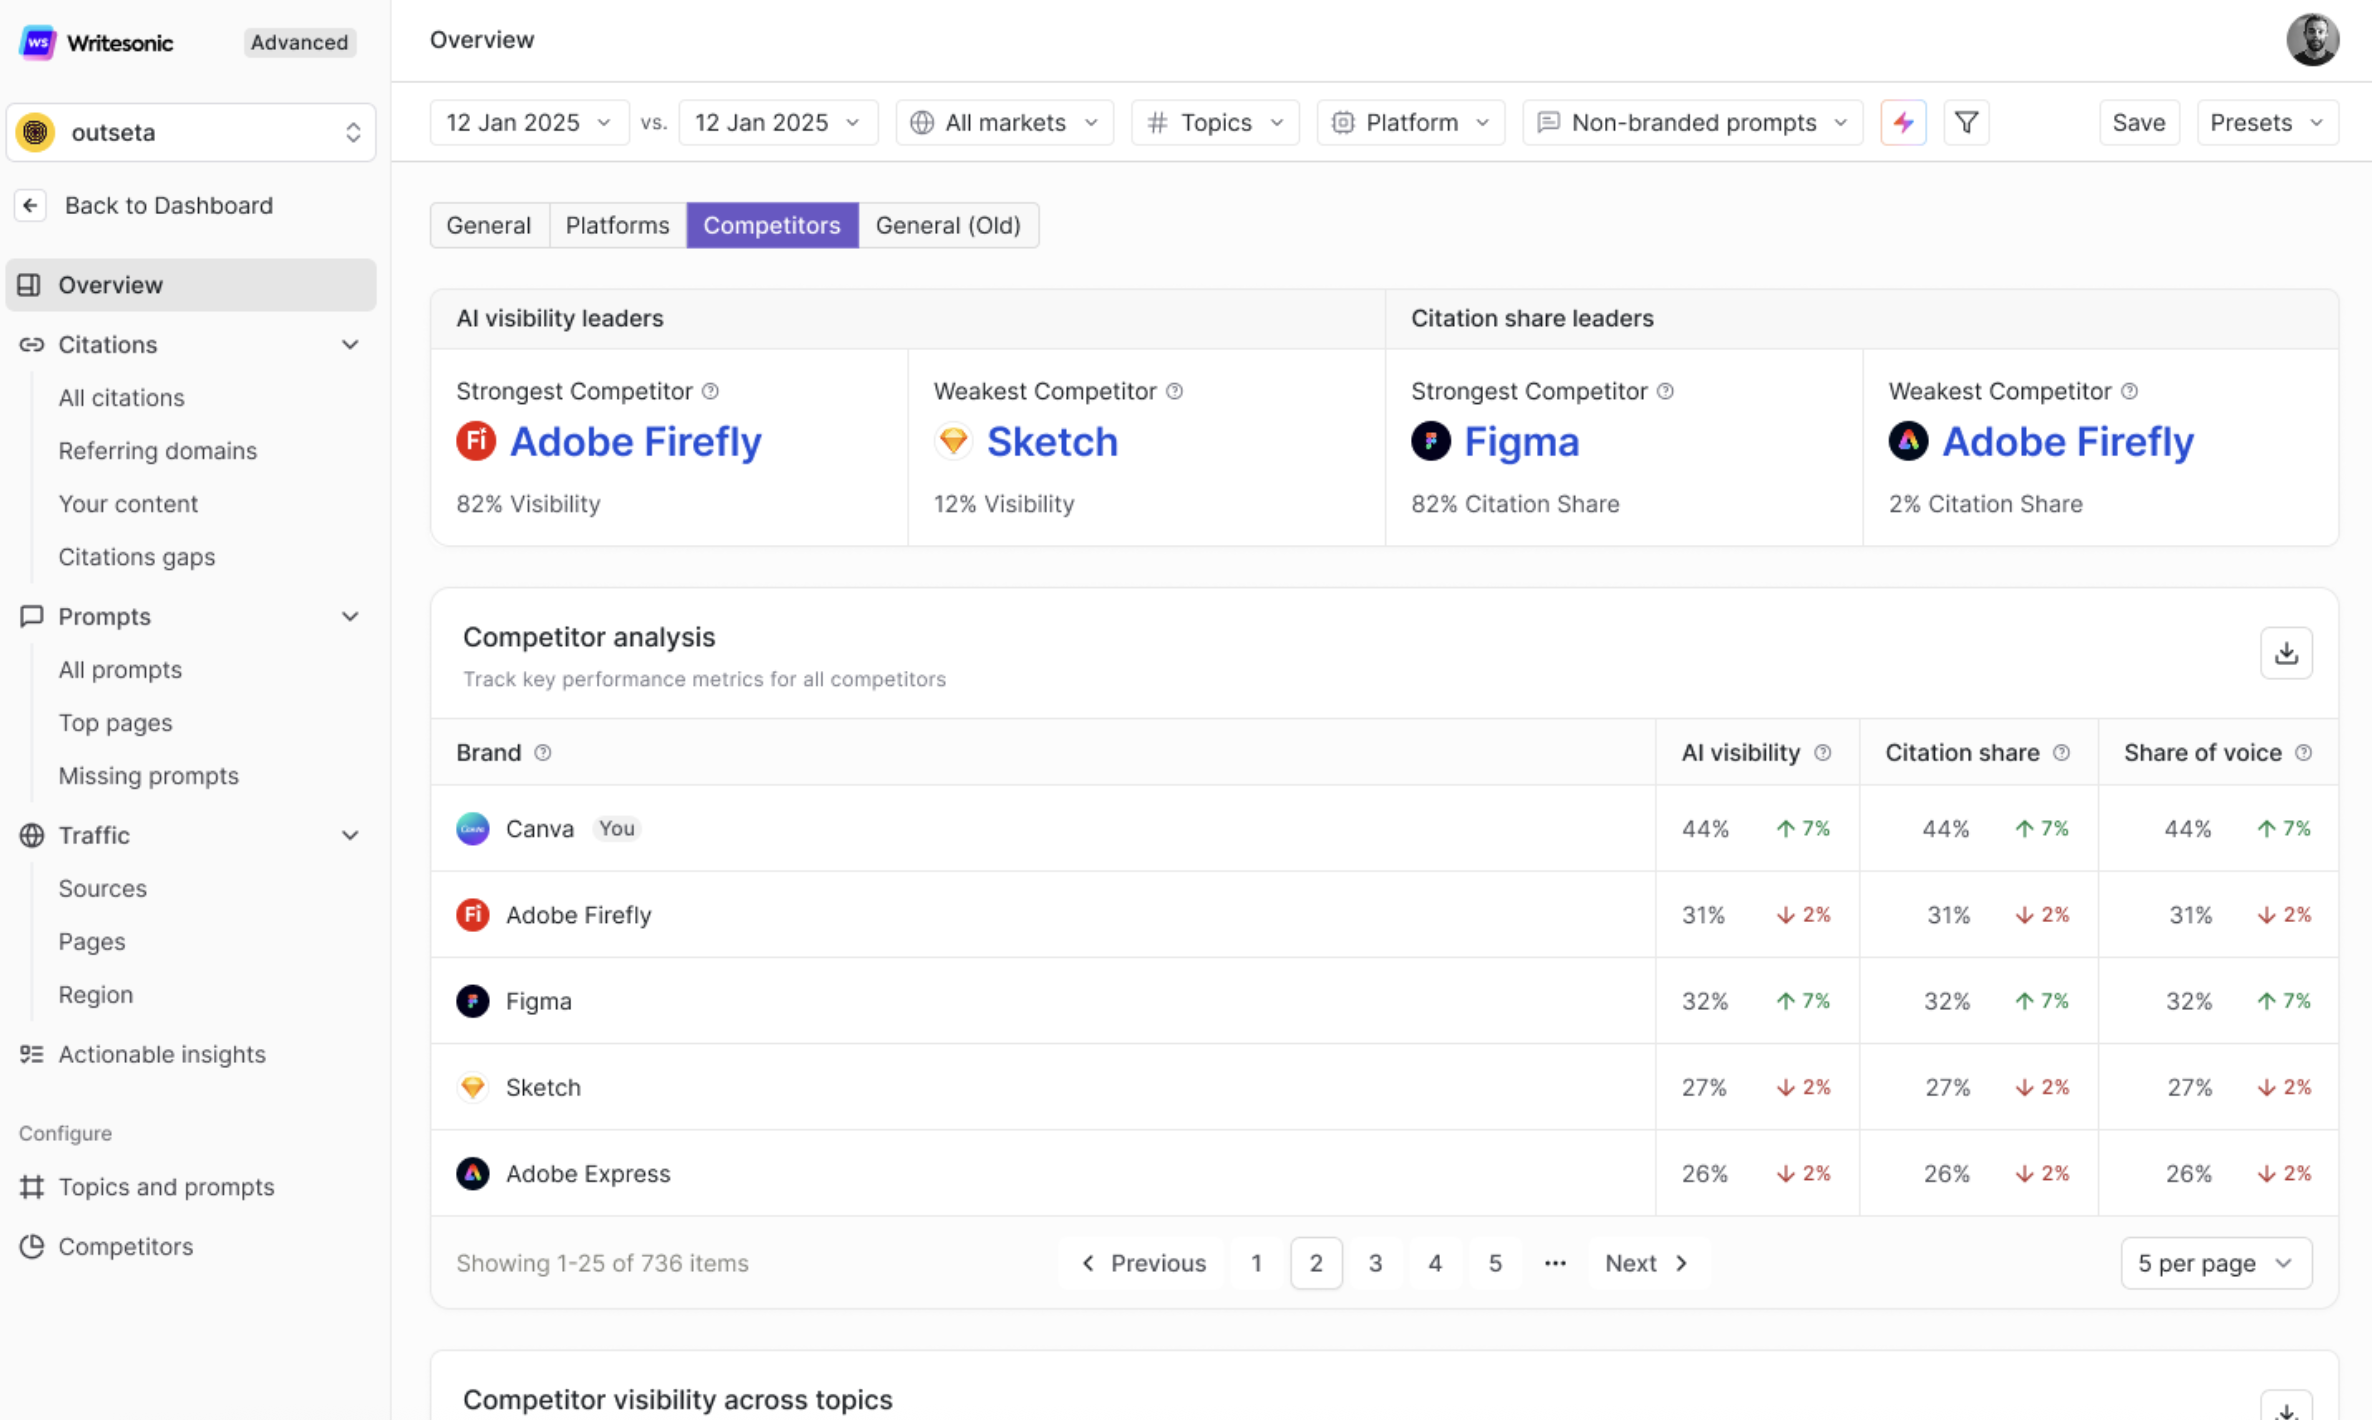
The Competitors on the Overview page gives you a clear picture of how your brand stacks up against the competition in AI-generated responses. It surfaces the key players in your space, tracks their performance over time, and helps you identify exactly where you're winning — and where you're falling behind.
This tab is designed to turn competitive intelligence into action. Whether you're benchmarking against direct rivals or discovering new competitors you hadn't considered, every section here is built to inform your next move.
AI Visibility Leaders & Citation Share Leaders
This section gives you an instant snapshot of the competitive extremes — who's leading and who's trailing — across two critical dimensions: AI visibility and citation share.
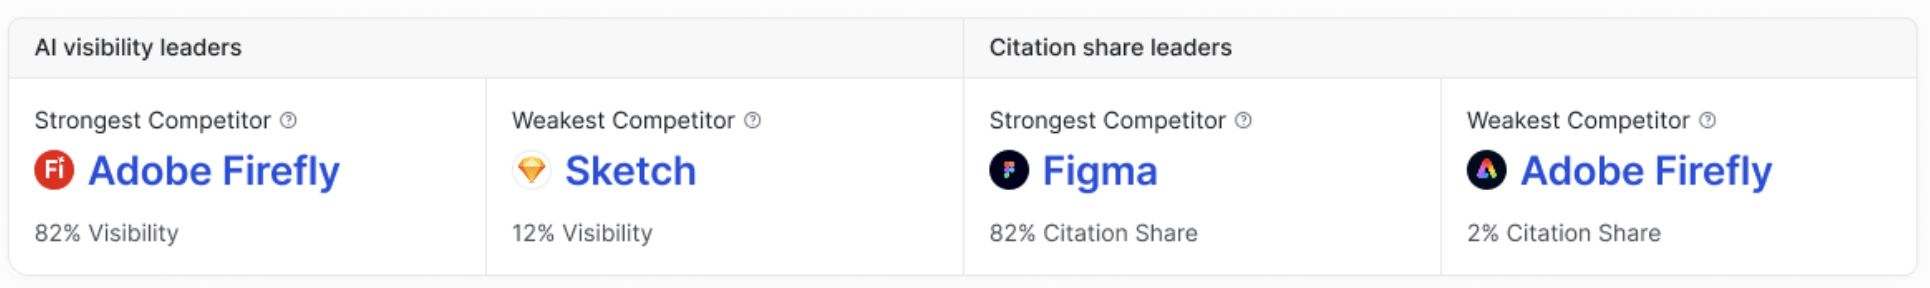
AI Visibility Leaders
- Strongest Competitor: The brand with the highest AI visibility among all your tracked competitors. This is the competitor appearing most frequently in AI-generated answers for your monitored topics and prompts.
- Weakest Competitor: The brand with the lowest AI visibility in your competitive set. Their low presence indicates limited traction with generative engines, often due to content gaps or lack of optimization.
Citation Share Leaders
- Strongest Competitor: The brand whose content is most frequently cited as a source by AI platforms. High citation share signals strong content authority — AI engines trust and reference their pages more than others.
- Weakest Competitor: The brand with the lowest citation share, meaning AI platforms rarely pull from their content as a reference source.
Why it matters:
These four data points establish the boundaries of your competitive landscape. The strongest competitors set the benchmark for what's achievable in your space, while the weakest reveal the floor. Use this to calibrate your own goals — if the top competitor holds high visibility, that's your target. If the weakest competitor's citation share is low, make sure you're not trending in the same direction.
Competitor Analysis
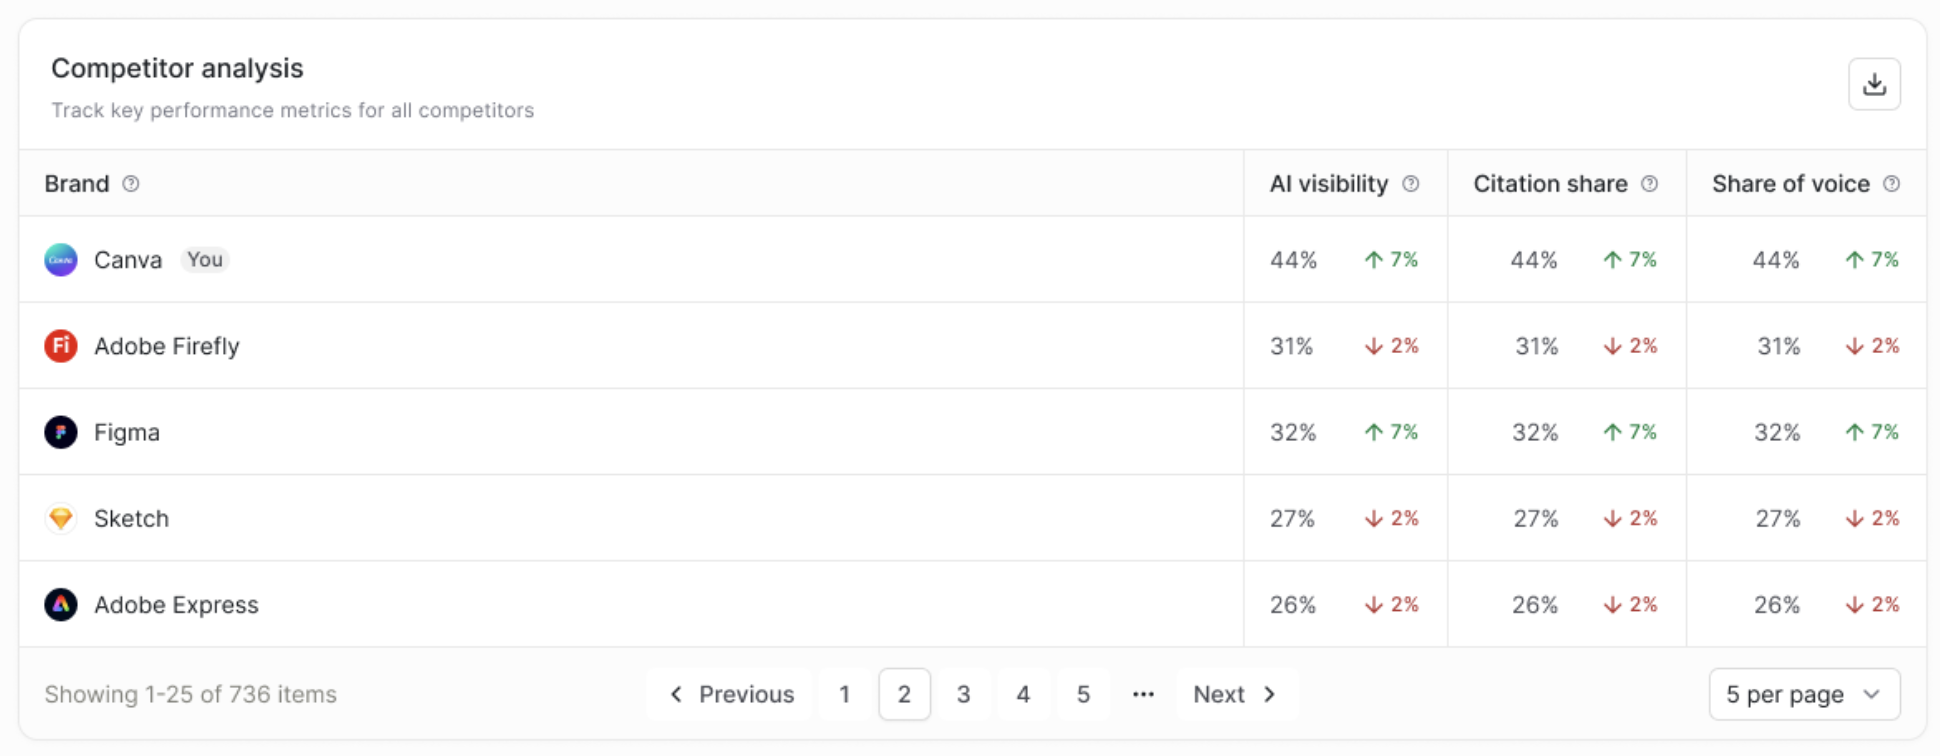
This is the core performance table of the Competitors tab. It provides a multi-dimensional, side-by-side comparison of every tracked competitor across the metrics that matter most.
What's Tracked
For each competitor (including your own brand), the table displays:
- AI Visibility (%): The percentage of AI-generated responses where this brand is mentioned. Trend arrows (↑ or ↓) show whether visibility is increasing or decreasing compared to the previous period.
- Citation Share (%): The percentage of citations attributed to this brand's content across all monitored AI responses. This reflects how often AI engines trust and source content from this brand.
- Share of Voice (%): A combined measure of the brand's overall presence in AI conversations relative to all tracked competitors. This accounts for both mentions and citations to give a holistic view of competitive standing.
Each metric includes a trend indicator showing the direction and magnitude of change, making it easy to spot which competitors are gaining or losing ground.
How to Use This
- Compare your brand against the field. Your brand is labeled "You" in the table for easy identification. See how your metrics line up against each competitor.
- Spot momentum shifts. A competitor with rapidly rising AI visibility may be executing a new content strategy worth investigating.
- Identify vulnerabilities. A competitor with high visibility but low citation share may be mentioned often but not trusted as a source — a gap you can exploit with authoritative content.
- Export the data. Click the download icon to export the table for reporting, presentations, or deeper analysis.
The table supports pagination and lets you control the number of results displayed per page, making it easy to navigate large competitor sets.
Competitor Visibility Across Topics
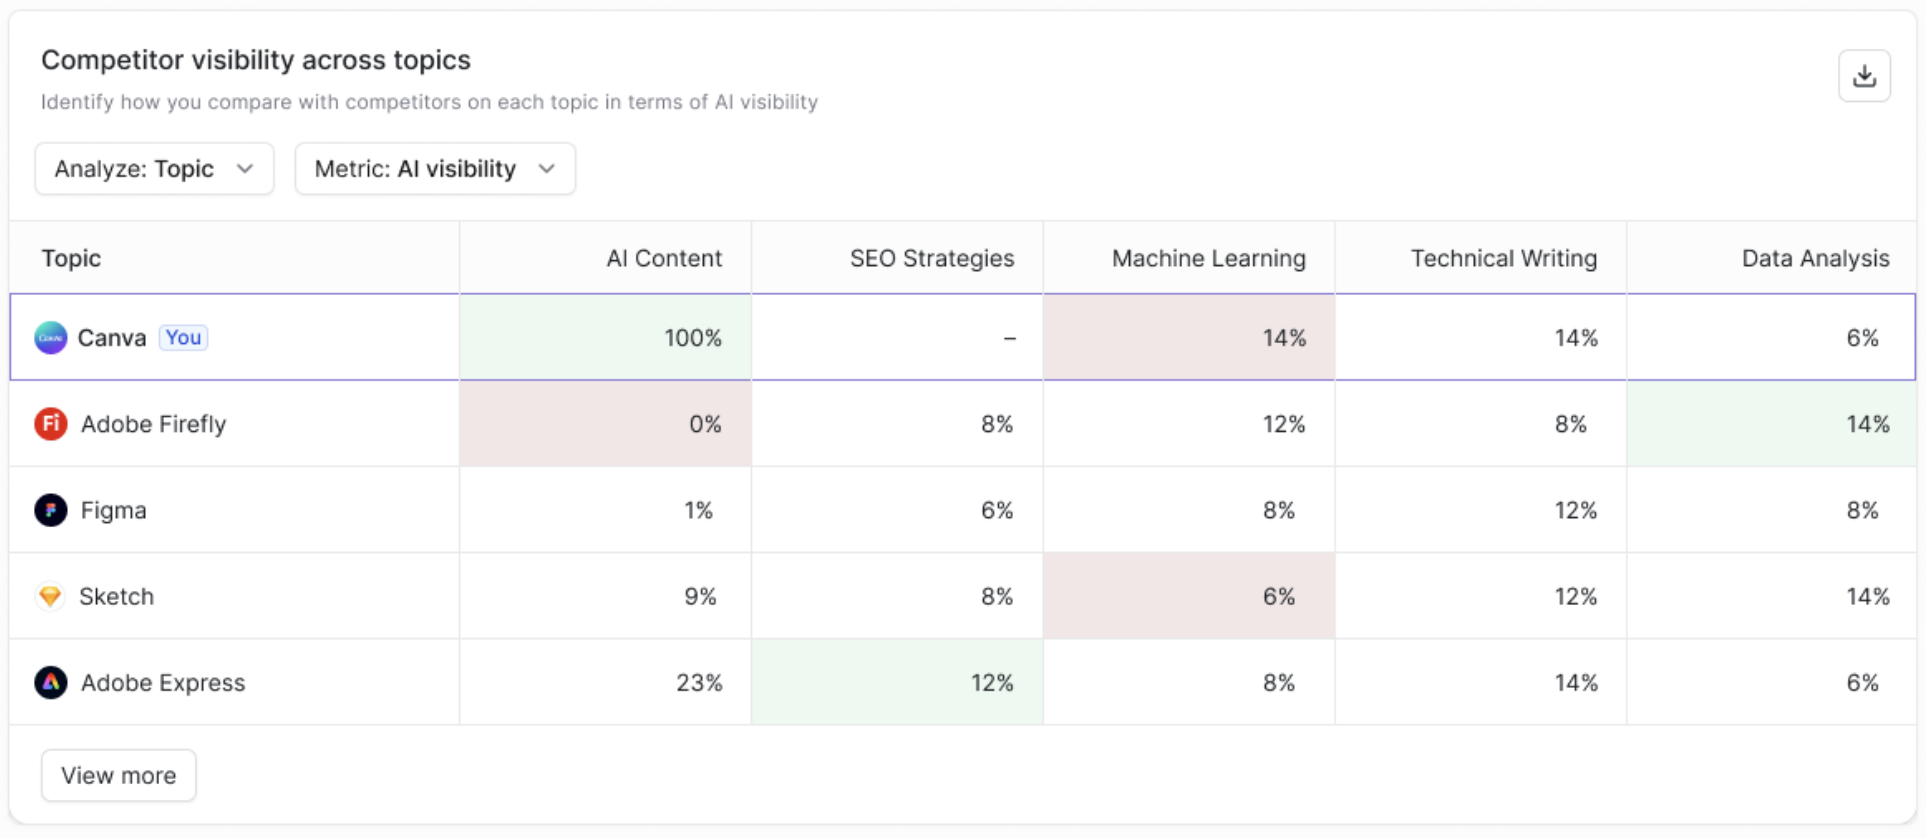
This section breaks down competitive performance at the topic level, revealing exactly where each brand dominates or falls short.
What It Shows
A matrix-style table where:
- Rows represent each tracked competitor (including your brand)
- Columns represent the topics you've configured for your GEO project
Each cell displays the competitor's visibility percentage or citation share for that specific topic. You can toggle between analyzing by Topic or Prompt and switch the metric between AI Visibility, Citation Share, or Share of Voice using the dropdown filters above the table.
Cells are color-coded to highlight performance:
- Green indicates strong performance or areas where you lead
- Red or blank cells signal weak presence or complete absence from AI responses for that topic
Why It Matters
This is where you move from high-level benchmarks to precision targeting. Instead of competing everywhere at once, topic-level visibility helps you make strategic decisions:
- Identify quick wins: Topics where competition is low and moderate content effort could establish your dominance.
- Defend your strengths: Topics where you currently lead but competitors are closing in.
- Attack strategically: High-value topics where a competitor leads but their position isn't insurmountable.
- Discover gaps: Topics where no competitor has strong visibility — these represent untapped opportunities.
You can also spot competitor content strategies from this view. A competitor dominating technical topics but absent from use-case or comparison topics reveals their focus areas — and the audience segments they're leaving underserved.
Click View more to expand the full topic matrix if your project tracks more topics than the default view displays.
Updated 5 months ago