Overview
The Citations Overview page is your command center for understanding how AI search engines reference and link back to your content. It brings together everything you need — citation volume, source authority, competitive gaps, and content performance — in a single, actionable view.
When AI platforms like ChatGPT, Perplexity, Claude, Google AI Overviews, or Bing Copilot generate answers, they often cite specific webpages as sources. This page shows you exactly which pages are being cited, how your brand stacks up against competitors, and where the biggest opportunities lie.
Note: The Citations Overview page supports two views — Branded prompts and Non-branded prompts — which you can toggle using the prompt type filter at the top. The branded view focuses on prompts that directly mention your brand, while the non-branded view shows prompts where AI could cite you based on topic relevance alone. Use the date range picker, market, topic, platform, and prompt type filters at the top of the page to narrow your analysis.
Quick Look Metrics
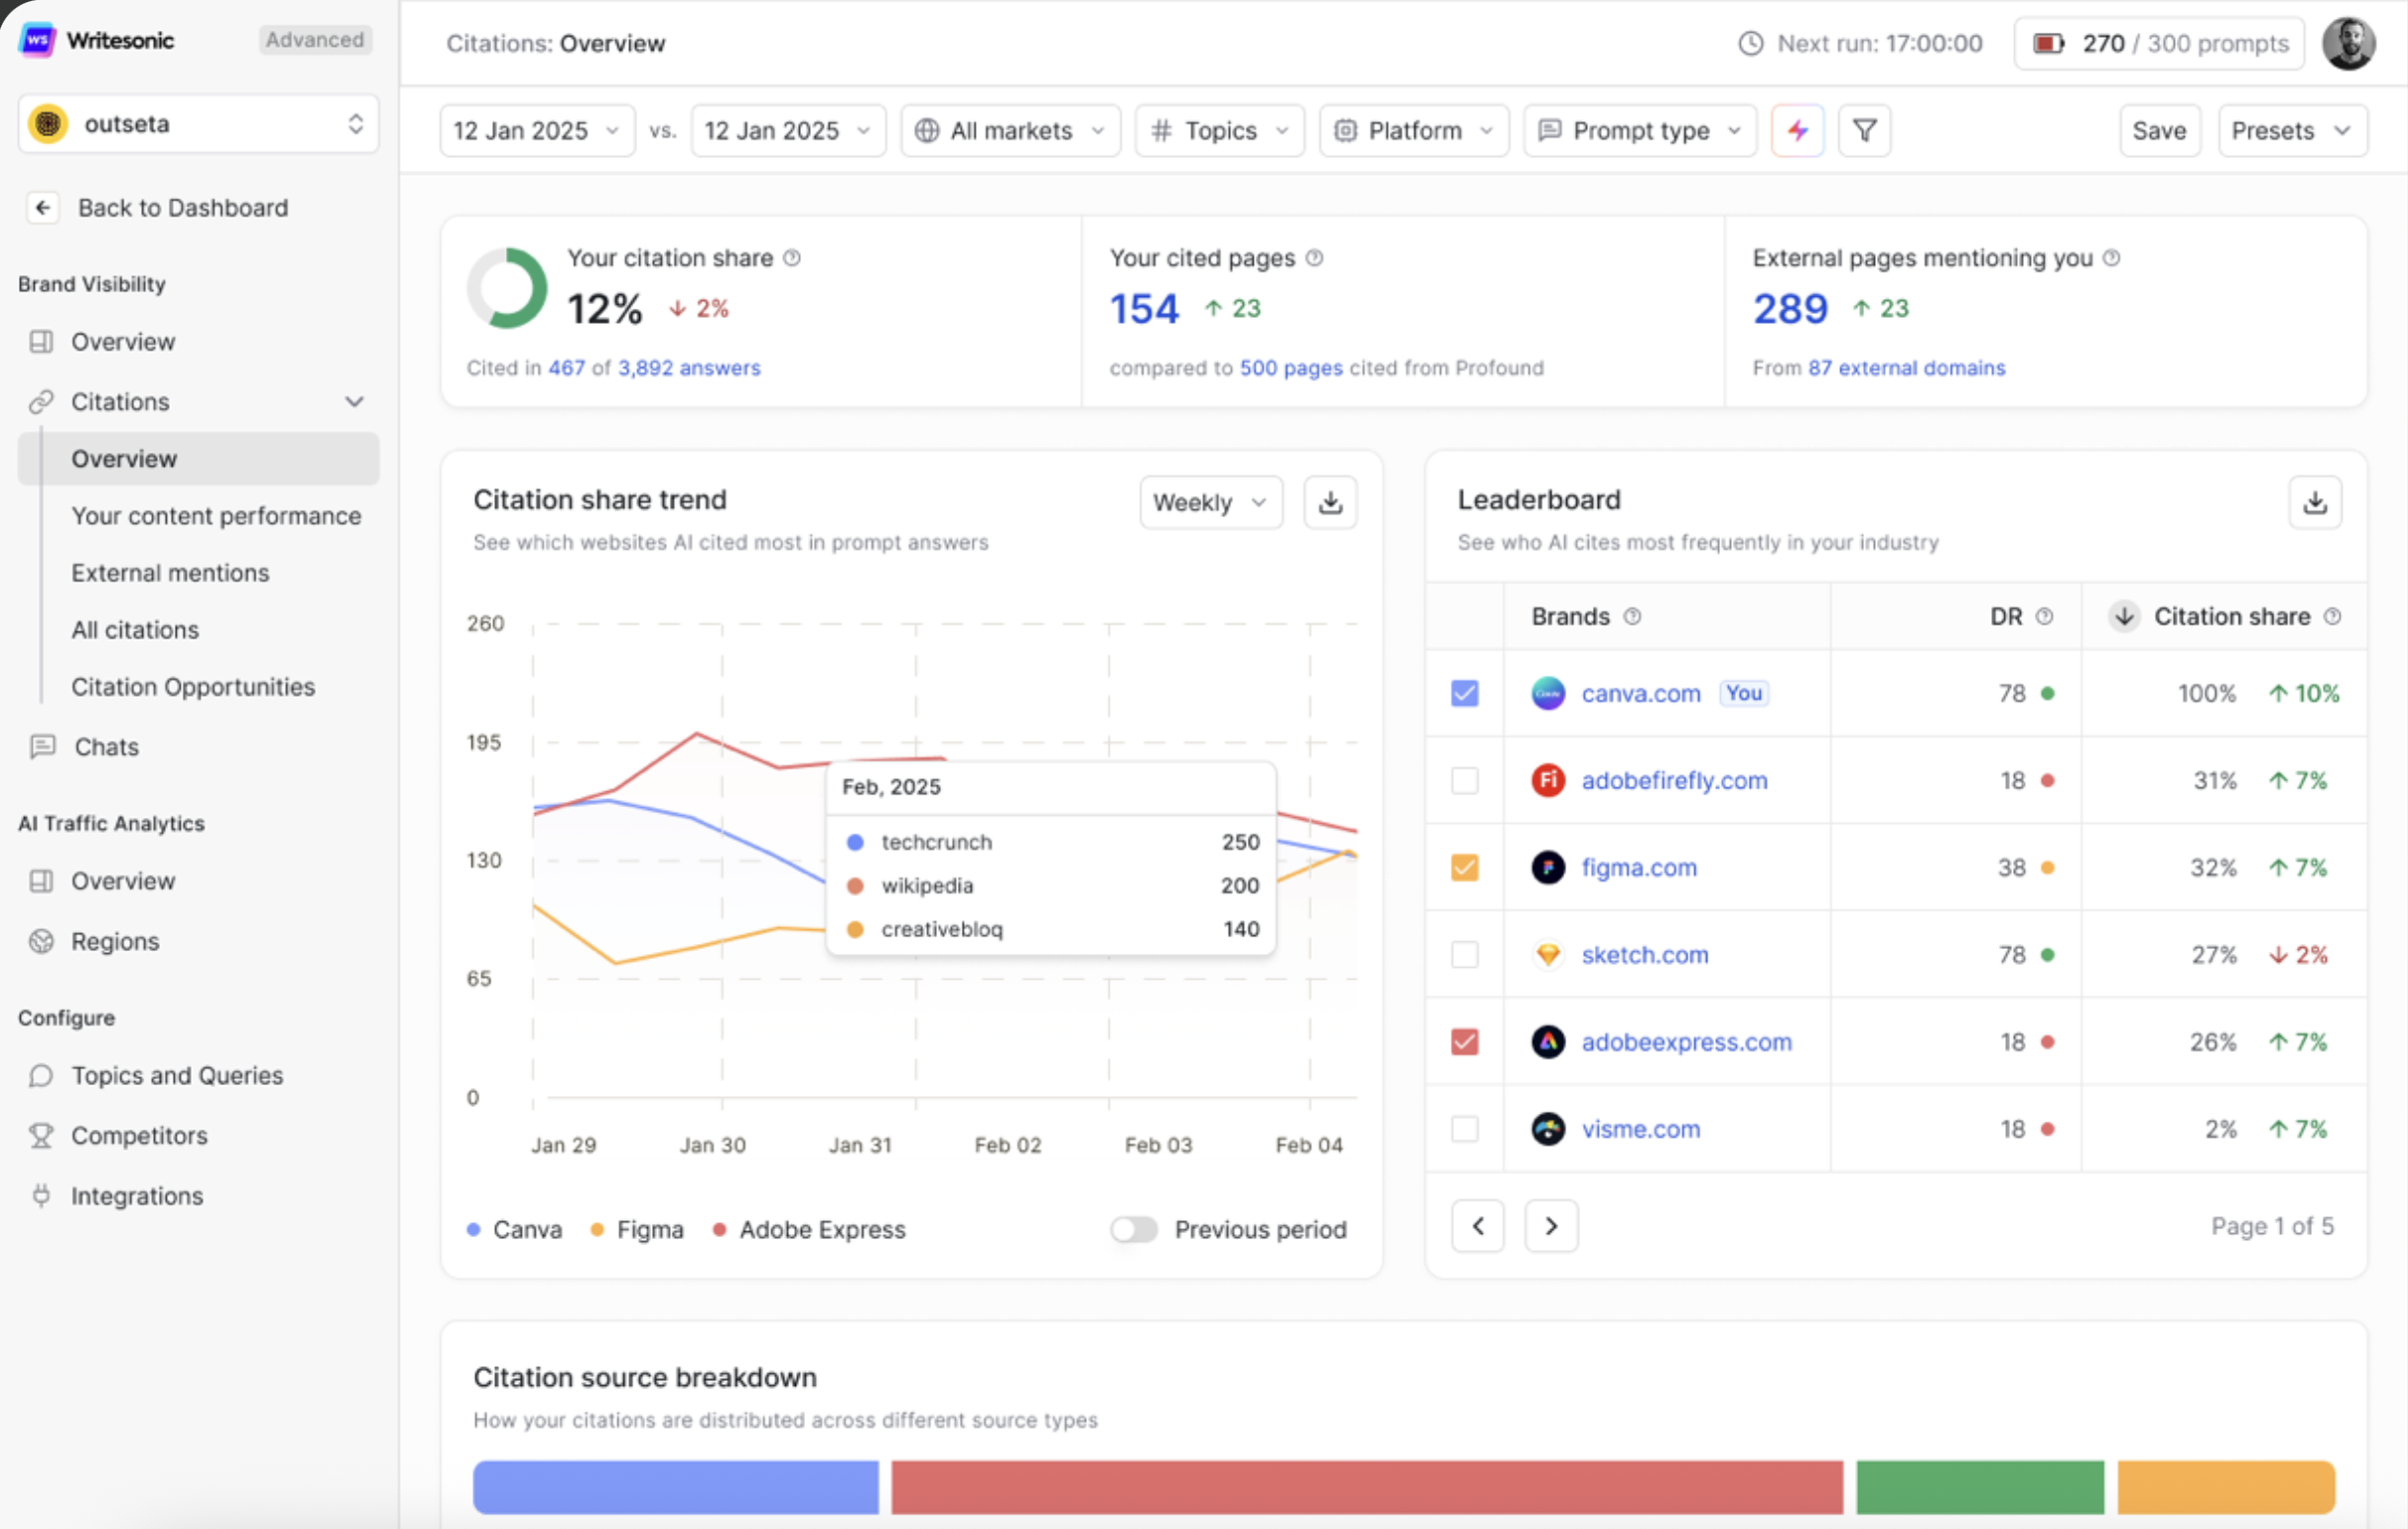
At the top of the page, three key performance indicators give you an instant snapshot of your citation health:

-
My citation share — The percentage of total AI citations in your tracked space that point to your domain. This is your overall share-of-voice in AI-generated citations. A higher percentage means AI engines are choosing your content more frequently as a trusted source. Track this over time to measure whether your GEO efforts are translating into more citations.
-
Your cited pages — The total number of unique pages from your website that AI platforms are actively citing as sources. This tells you how much of your content library AI engines consider worth referencing. A growing number here means your content portfolio is expanding its authority footprint. The comparison indicator shows how this compares to the total pages cited across all brands in your space.
-
External pages mentioning you — The count of third-party pages (from external domains) that mention your brand and are being cited in AI answers. These are pages you don't own but that reference your brand — and AI is using them as sources. A higher count signals strong brand presence across the broader web ecosystem.
Citation Share Trend
This time-series chart tracks how your citation share has changed over your selected date range.
- The trend line plots your citation share percentage over time — whether it's weekly or across a custom period.
- Use the Previous period toggle to overlay the prior period's data for direct comparison.
- Each data point on the chart represents the citation share for that specific time interval.
Why it matters: This chart is your clearest indicator of momentum. A rising trend means your content is gaining trust with AI engines. A declining trend may signal that competitors are producing stronger content or that your existing pages need refreshing. Use it to correlate citation performance with specific content updates, campaigns, or outreach efforts.
Leaderboard / Competitive Leaderboard
This section shows a ranked list of brands (including yours) that AI cites most frequently in your industry.
- Each row displays the brand domain, its Domain Rating (DR), and its citation share percentage.
- Your brand is highlighted with a "You" tag for easy identification.
- The change indicator next to the citation share shows movement compared to the previous period.
- When viewing non-branded prompts, this section is titled Competitive Leaderboard and shows only competitor domains (excluding your brand), giving you a clear view of who dominates when your brand isn't directly named.
- Use the pagination arrows to browse through additional brands beyond the initial view.
Why it matters: This is your competitive benchmarking at a glance. It tells you exactly where you rank among competitors for AI citation share and whether you're gaining or losing ground. If a competitor's citation share is climbing while yours is flat, it's a signal to investigate what content they're producing or which sources they're getting cited on.
Citation Source Breakdown
This horizontal bar chart categorizes your citations by the type of source citing you:
- Owned — Citations from your own domain's pages.
- Competitor — Citations from competitor domains.
- Third party websites — Citations from independent, non-competitor domains (blogs, news sites, publications).
- Social & Forums — Citations from community platforms like Reddit, Quora, or niche forums.
Each category shows its percentage share of your total citations.
Why it matters: A healthy citation profile has a balanced mix of source types. Heavy reliance on owned citations means you're essentially citing yourself — which is limited in impact. A strong share of third-party and social citations indicates that external, independent sources trust and reference your brand, which carries more weight with AI engines. If competitor citations are high, those pages may be mentioning you in comparison contexts — worth investigating further.
Most Cited Domains / Most Cited Webpages
This section provides a ranked view of the domains and webpages AI cites most when answering prompts in your tracked space. You can toggle between Webpages and Domains views.
Webpages View
A ranked table of specific pages most frequently cited in AI answers. Each row includes:
- Cited page — The page URL and title being referenced by AI.
- Citation share — The percentage of AI answers citing this specific page, with a change indicator.
- Source type — Whether this page belongs to your brand, a competitor, or a third party.
- Citing answers — The total number of AI-generated answers referencing this page, with a change indicator.
- Mentions you — Whether or not this cited page mentions your brand (indicated by a check or cross icon).
Domains View
A ranked table aggregated at the domain level. Each row includes:
- Cited Domain — The root domain being referenced.
- DR — The Domain Rating of that domain.
- Citation share — The percentage of total citations this domain captures, with a change indicator.
- Source type — Whether this is your brand, a competitor, or a third-party domain.
- Citing answers — How many AI answers cite pages from this domain.
- Pages cited — The total number of individual pages from this domain that are being cited.
Click "Show all domains" or "Show all webpages" to expand the full list.
Why it matters: This table reveals who your real competition is in AI citations — and it may not always be your traditional business competitors. Third-party blogs, news outlets, or community sites can dominate AI citations in your space. Understanding which specific pages and domains hold the most citation share helps you prioritize outreach, content creation, and competitive analysis.
Citation Opportunities
This section highlights high-value sources that are citing your competitors but not yet citing your brand. These are your most actionable gaps.
You can toggle between Webpages and Domains views.
Webpages View
Each row shows:
- Cited page — The specific page URL and title.
- Citation share — How much citation share this page commands, with a change indicator.
- Brands mentioned — Which competitor brands are mentioned on this page (shown as brand icons).
- Source type — Whether this is a competitor page or a third-party page.
- Citing answers — The number of AI answers referencing this page.
Domains View
Each row shows:
- Cited Domain — The root domain.
- Citation share — The domain's overall citation share percentage, with a change indicator.
- Brands mentioned — Competitor brands mentioned across pages on this domain.
- Source type — Competitor or third-party classification.
- Citing answers — Total AI answers citing this domain.
- Pages cited — Total number of pages from this domain that are being cited.
Click "Show all webpages" or "Show all domains" to view the complete list.
Why it matters: These represent your highest-impact opportunities. Since these pages are already trusted by AI engines and actively being cited, getting your brand mentioned or linked on them significantly increases your chances of being included in AI answers. Prioritize outreach to pages with high citation share and high DR for maximum impact.
Top Cited Content
This section shows the pages driving the most AI citations — split into two tabs: Your brand and Competitors.
Your Brand Tab
A ranked list of your own pages that receive the most AI citations. Each row includes:
- Cited Page — Your page URL and title.
- Citation share — The percentage of AI citations pointing to this page, with a change indicator.
- Mentions you — Whether your brand is explicitly mentioned in the citing AI answer (indicated by a check or cross icon).
- Brands mentioned — Other brands mentioned alongside your content (shown as brand icons).
- Citing answers — The number of AI-generated answers citing this page.
Competitors Tab
The same table structure but showing your competitors' top-performing pages — so you can analyze what types of content earn the most AI citations in your space.
Click "Show all webpages" to view the complete list for either tab.
Why it matters: Your top-cited pages are your strongest content assets. Keep them updated, expand their coverage, and study what makes them successful. On the competitors side, analyze their winning pages to understand content formats, depth, and topics that earn the most AI trust — then apply those learnings to your own content strategy.
Your Citation Share vs. Competitors
This comparative matrix is one of the most powerful analytical tools on the page. It shows how your citation share stacks up against competitors across two dimensions — by topic and by platform.
Analyze by Topic
- Rows represent brands (your domain and competitors).
- Columns represent topics you're tracking (e.g., keyword research, link building, optimization, SEO copywriting).
- Each cell shows the citation share percentage for that brand within that topic, along with a change indicator.
- Green cells highlight top performers for that topic. Red cells indicate bottom performers.
- Your brand row is highlighted with a "You" tag for easy identification.
Analyze by Platform
- Rows represent brands.
- Columns represent AI platforms (e.g., ChatGPT, Claude, Perplexity, Bing).
- Each cell shows the citation share for that brand on that specific platform, with a change indicator.
- Color coding works the same way — green for leaders, red for lagging brands.
Use the Metric dropdown to switch between Citation share and other available metrics.
Pagination controls at the bottom let you navigate through all brands in your tracked competitive set.
Why it matters: This matrix instantly reveals your strategic positioning. You can identify topics where you dominate and need to defend, topics where competitors lead and you should invest, and platforms where your content performs differently. For example, you might have strong citation share on Perplexity but weak performance on ChatGPT — signaling a need to optimize content specifically for ChatGPT's citation patterns.
Updated 5 months ago