AI Bot(Traffic) Analytics
What is AI Traffic Analytics?
AI Traffic Analytics reveals the previously invisible traffic from AI systems like ChatGPT, Claude, and Google Gemini that visit your website. While traditional analytics platforms like Google Analytics miss these visits completely, our system captures every AI crawler interaction with your content through server-side tracking.
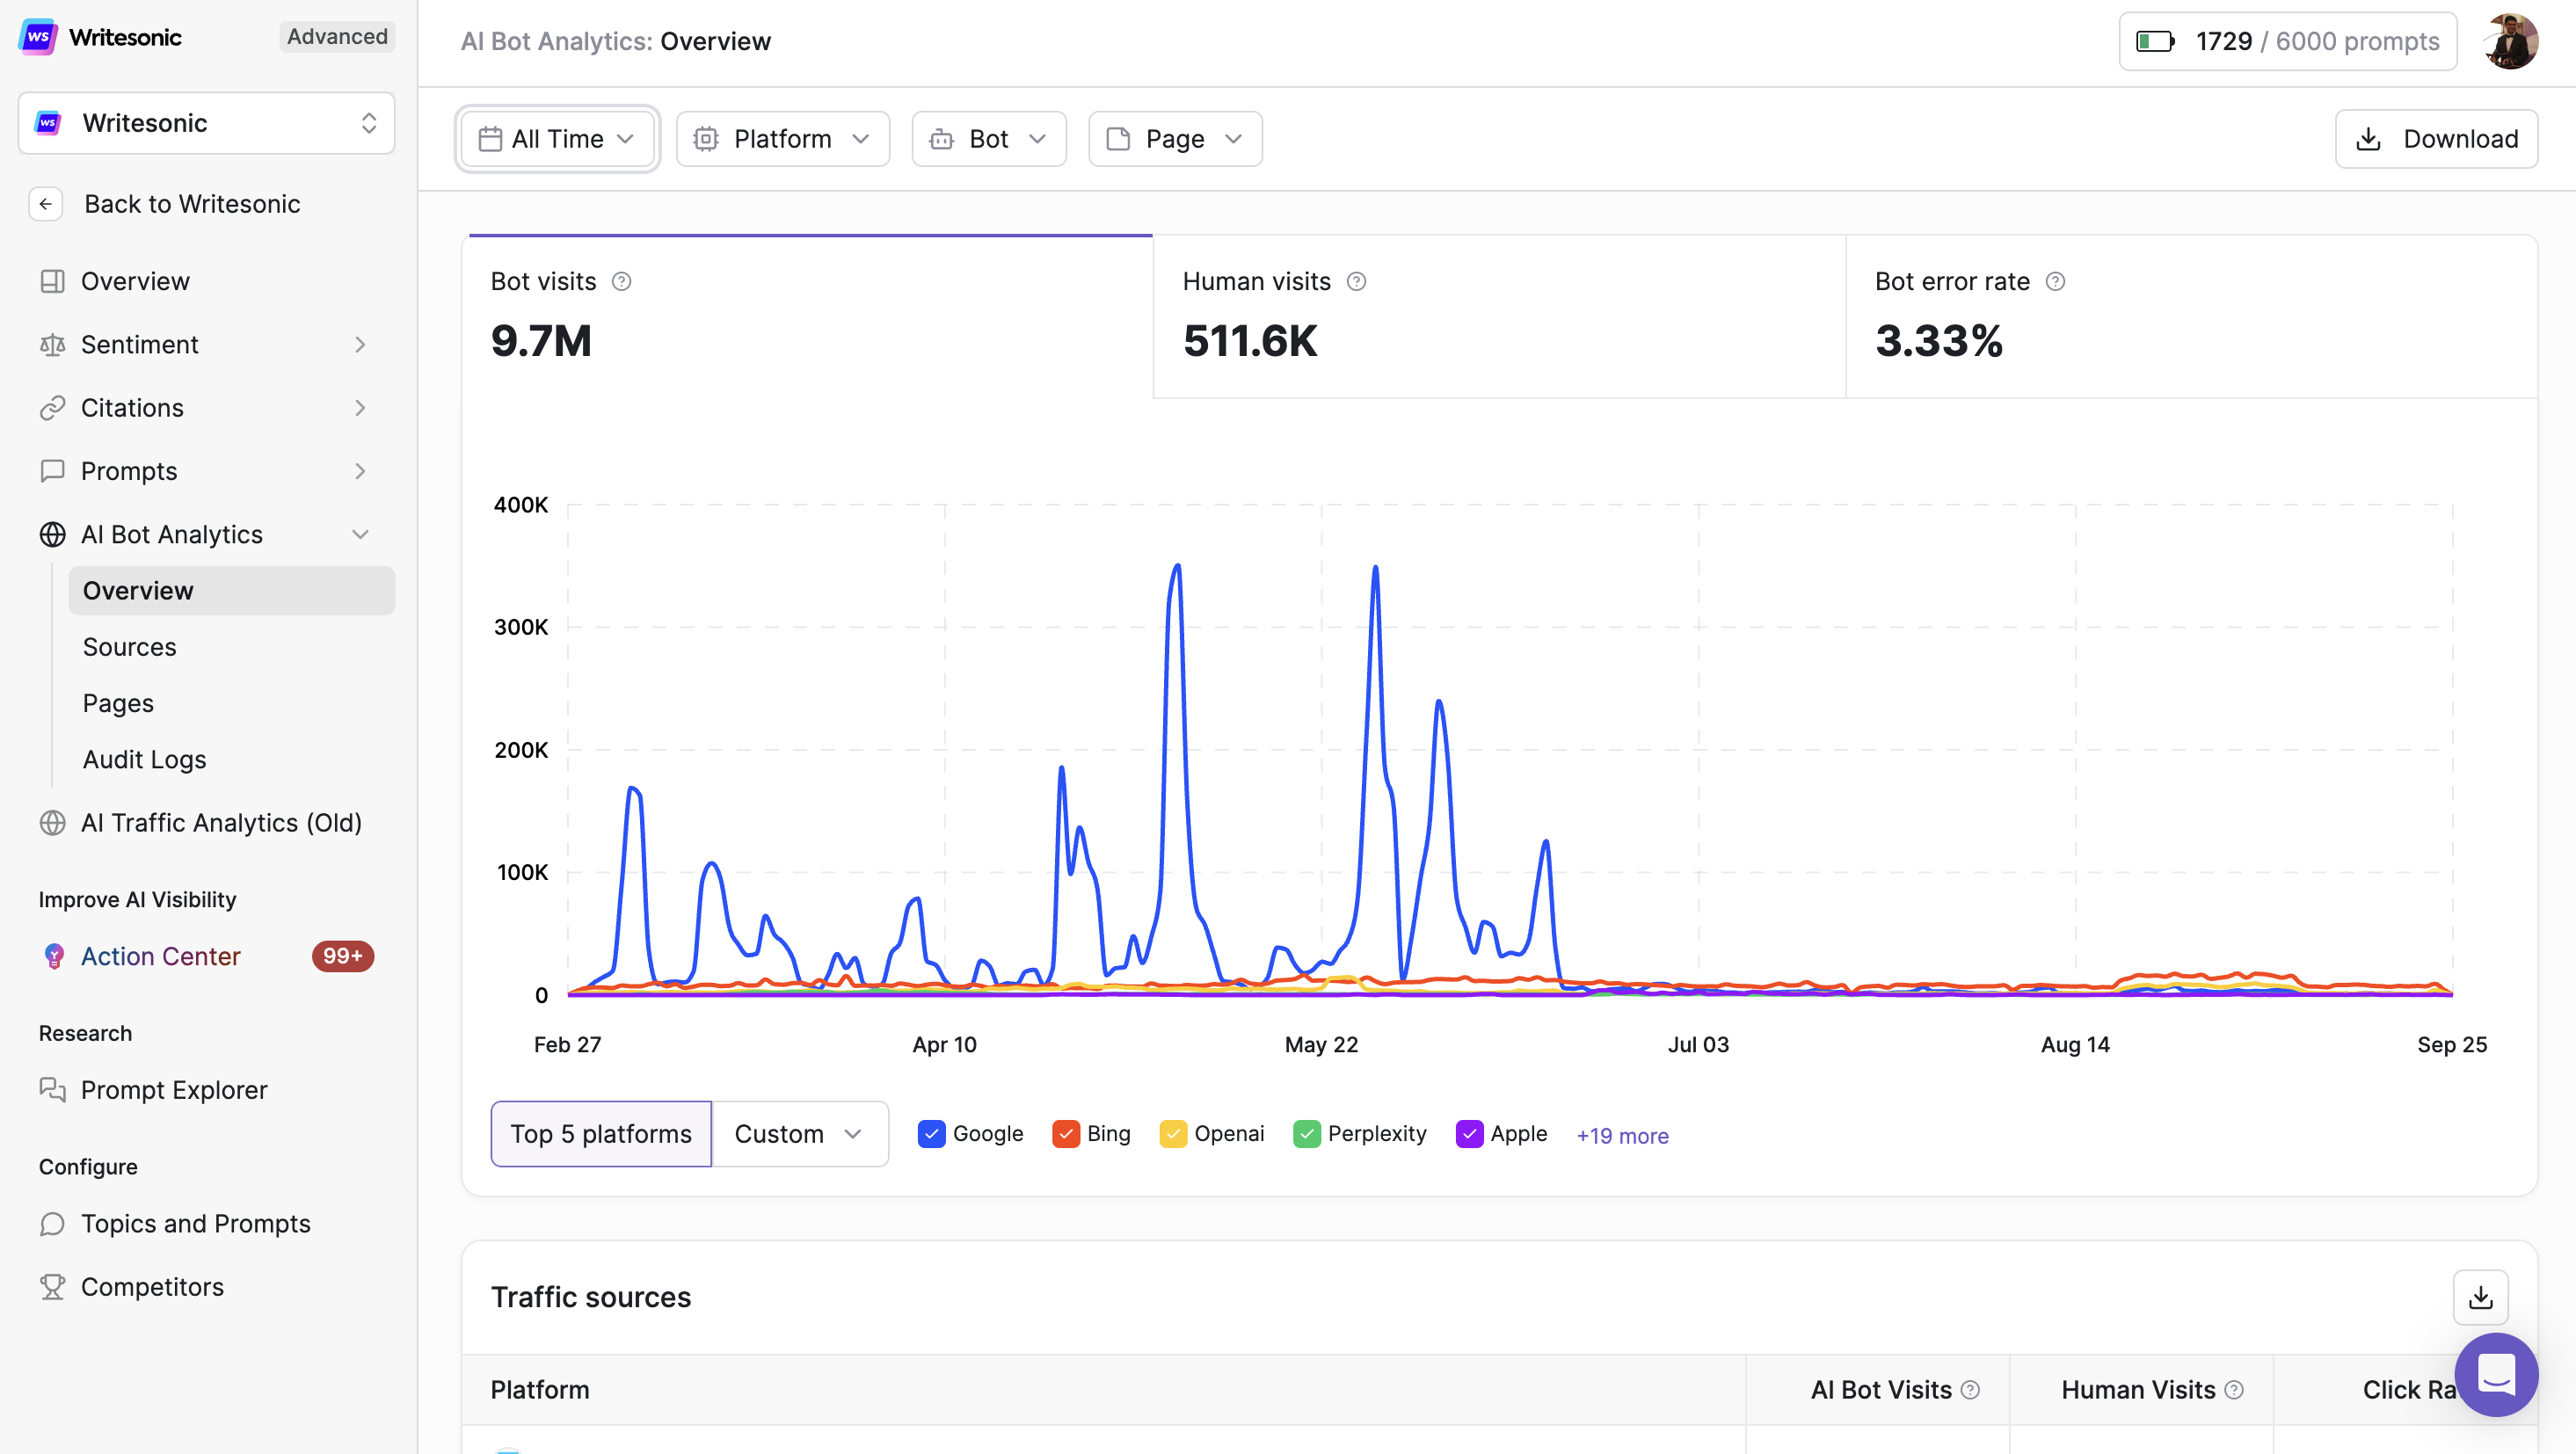
Key Metrics Definitions
Bot Visits: Total number of HTTP requests from identified AI platform bots to your website pages.
Human Visits: Verified human users who arrived at your site by clicking links in AI-generated responses.
Click Rate: Percentage calculated as (Human Visits / Bot Visits) × 100, indicating the quality and relevance of AI exposure.
Bot Error Rate: Percentage of bot requests resulting in error status codes, calculated as (Failed Requests / Total Requests) × 100.
AI Chatbot: Real-time content fetching bots that retrieve information to compose immediate responses to user queries.
Search Indexing: Systematic crawling to build searchable databases for future query retrieval.
AI Training: Data collection crawls used to train and improve AI models.
Quick guide
Part 1: Understanding the Fundamentals
What AI Bot Analytics Tracks
AI Bot Analytics monitors three critical stages of AI-driven traffic:
- Discovery Stage: When AI bots crawl and index your content
- Citation Stage: When AI platforms reference your content in responses
- Conversion Stage: When users click through from AI citations to your site
The Metrics That Matter
Before diving into the platform, understand these core metrics:
- Bot Visits: Raw crawl volume from AI platforms
- Human Visits: Actual users arriving from AI citations
- Click Rate: The efficiency of converting bot attention to human traffic
- Bot Error Rate: Technical barriers preventing AI access
Part 2: Initial Setup and Audit
Step 1: Conduct Your First AI Visibility Audit
Navigate to: AI Bot Analytics > Overview
What to check first:
- Bot Error Rate - This is your priority
- Total Bot Visits - Establishes your baseline
- Platform Distribution - Which AI platforms know you exist
Action Items:
- Note any platforms with zero bot visits (opportunity gaps)
- Identify your top 3 performing pages by click rate
Step 2: Technical Health Check
Navigate to: AI Bot Analytics > Pages > Non Accessible Pages
Priority Order for Fixes:
- 404 Errors - Broken links losing you visibility
- 403 Errors - Authentication/permission issues
- 500 Errors - Server problems affecting all crawlers
Dashboard Components
1. Overview Dashboard
The Overview provides a comprehensive snapshot of your AI-driven traffic performance across all key metrics.
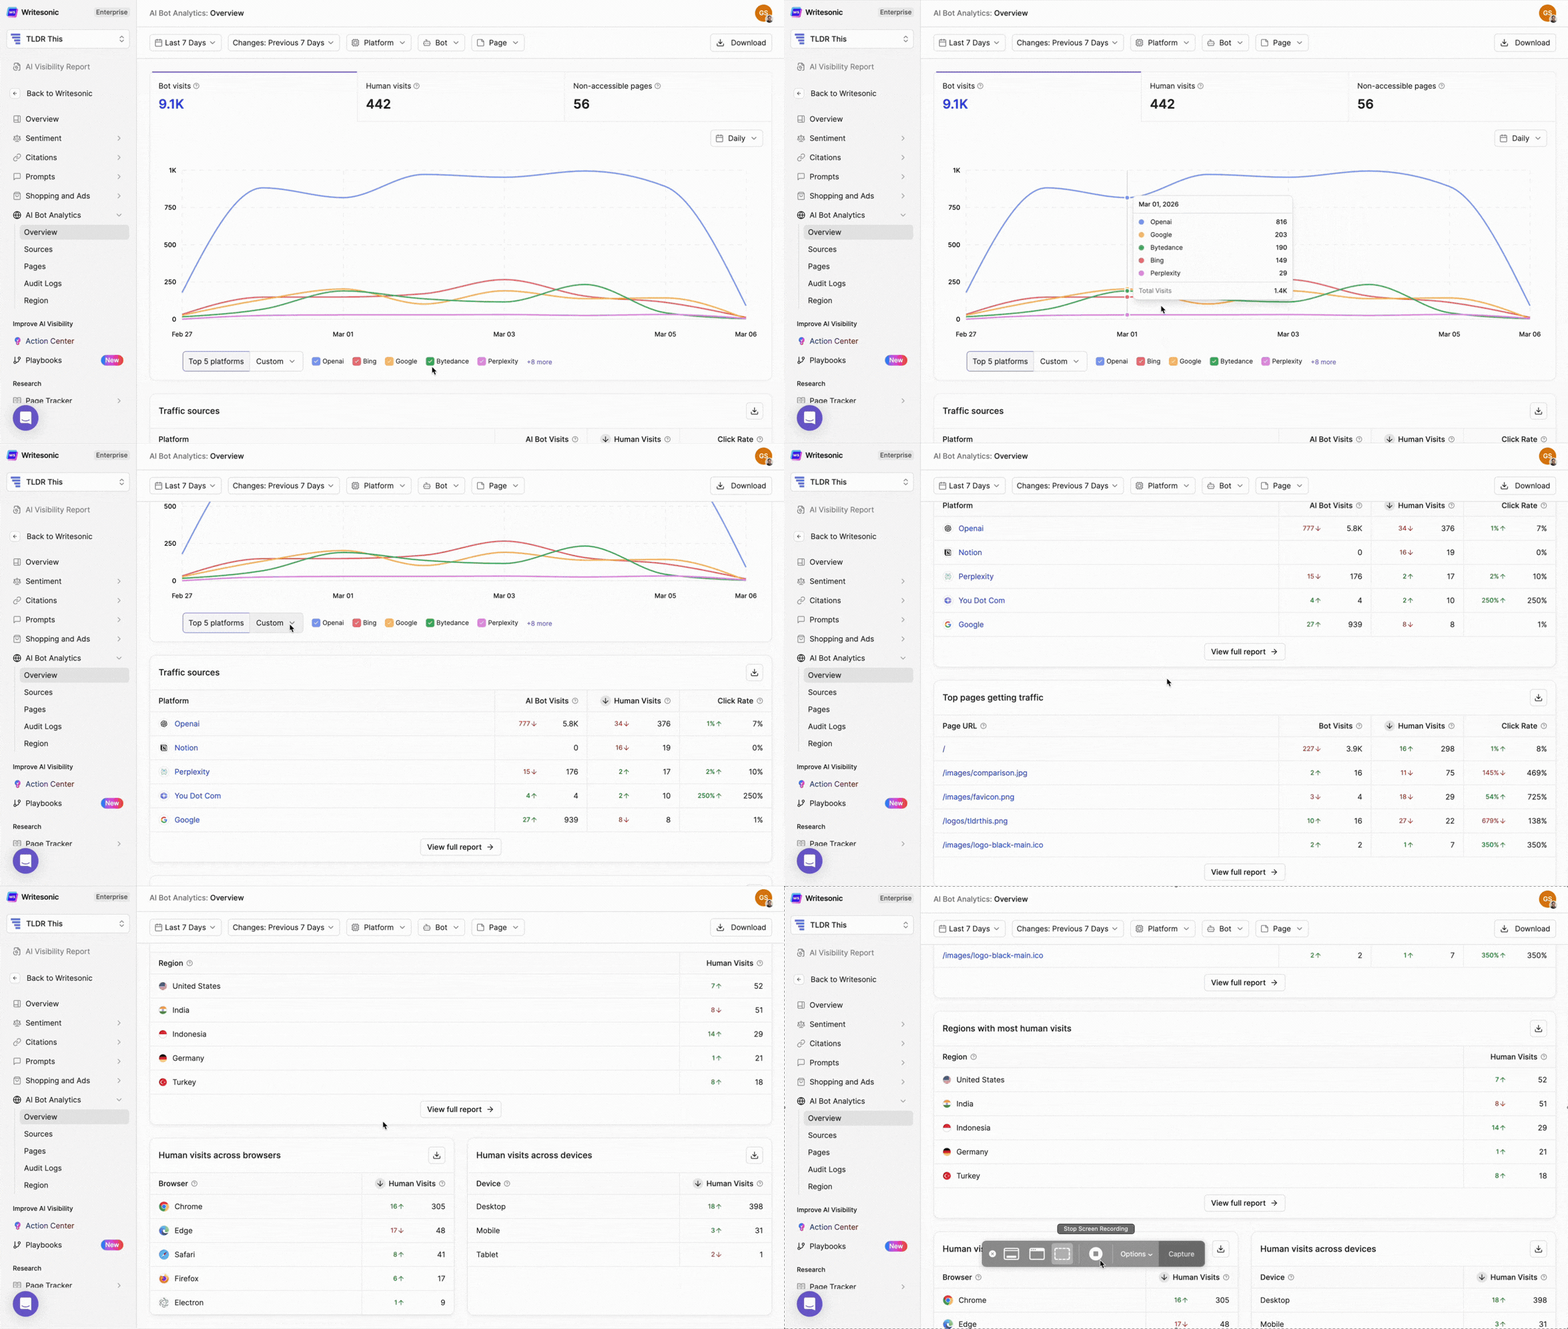
Core Metrics Section
Three primary KPIs:
- Bot Visits: Total number of times AI bots accessed your website pages. This includes chatbots fetching content for real-time answers, indexing bots building their knowledge base, and training bots collecting data.
- Human Visits: Actual users who clicked through to your site from AI-generated responses. This represents the real business value of AI citations.
- Bot Error Rate: Percentage of bot requests that resulted in errors (4xx/5xx status codes). A high error rate indicates technical issues preventing AI platforms from accessing your content.
Time-Series Graph
Interactive visualization showing bot visits and human visits over time. Use the platform filter to analyze specific AI sources (Google, Bing, OpenAI, Perplexity, Apple, etc.) or view aggregate data across all platforms.
Traffic Sources Table
Platform-level breakdown showing:
- Platform: AI platform name and logo
- AI Bot Visits: Number of bot crawls from each platform
- Human Visits: Click-throughs generated from each platform’s citations
- Click Rate: Conversion rate from bot visits to human visits (quality indicator)
Top Pages Getting Traffic
Page-level performance metrics displaying:
- Page URL: Specific pages being accessed
- Bot Visits: Total bot traffic per page
- Human Visits: Resulting human traffic per page
- Click Rate: Page-specific conversion metrics
Platform to Pages Journey
Visual funnel showing the flow from AI platforms → bot types → specific page URLs, helping you understand which platforms are interested in which content.
Browser & Device Analytics
Validation metrics for human traffic showing:
- Browser distribution: Chrome, Safari, Edge, Firefox, Opera breakdown
- Device types: Desktop, Mobile, Tablet distribution These metrics confirm genuine human traffic and help optimize user experience.
2. Sources Dashboard
The Sources section provides detailed analysis of each AI platform’s interaction with your site.
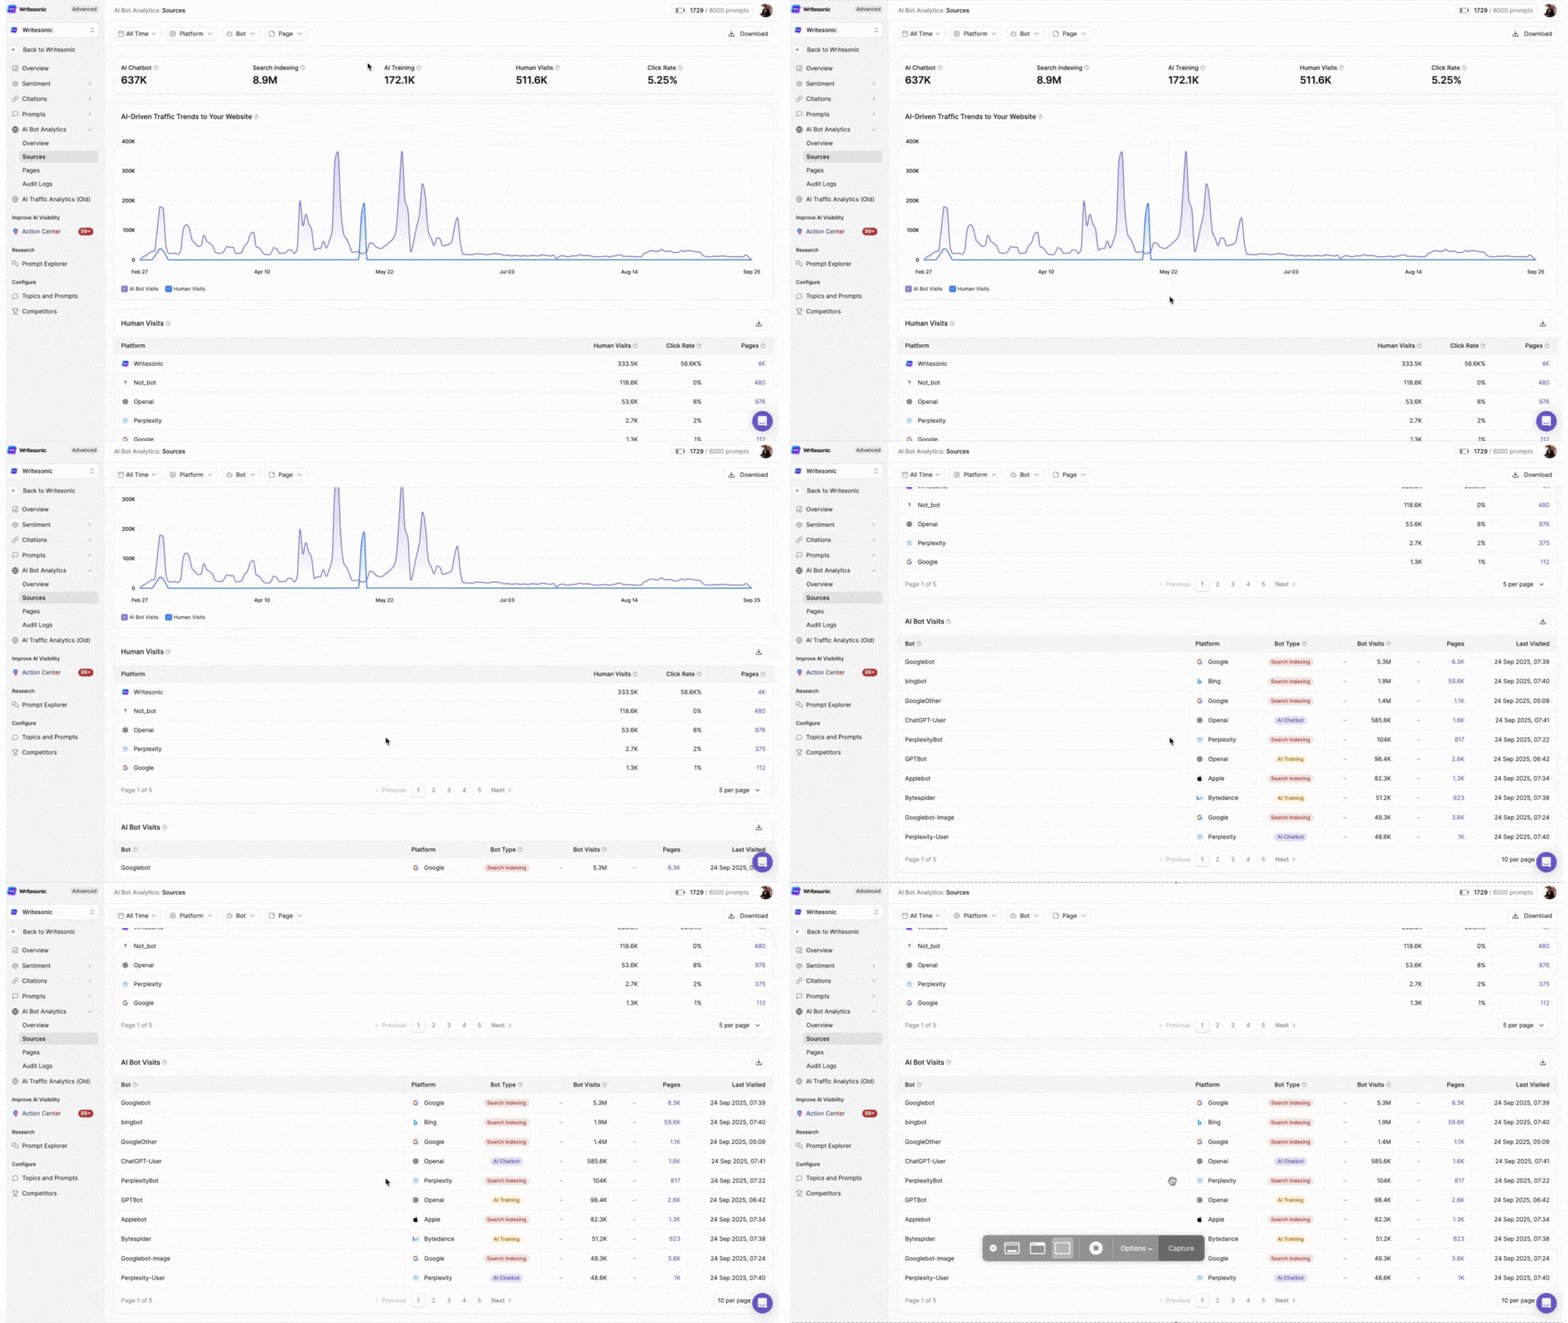
Aggregate Metrics
Top-level KPIs segmented by bot purpose:
- AI Chatbot: Visits from conversational AI fetching content for real-time responses
- Search Indexing: Crawls for building searchable knowledge bases
- AI Training: Data collection for model training purposes
- Human Visits: Total click-throughs across all sources
- Click Rate: Overall conversion efficiency
AI Bot Visits Table
Comprehensive platform breakdown including:
- Bot: Specific bot identifier (Googlebot, bingbot, ChatGPT-User, PerplexityBot, etc.)
- Platform: Parent AI service
- Bot Type: Classification (AI Chatbot, Search Indexing, AI Training)
- Bot Visits: Volume of crawl activity
- Pages: Number of unique pages accessed
- Last Visited: Most recent bot activity timestamp
Use Cases:
- Identify which AI platforms show the most interest in your content
- Spot unusual activity patterns or traffic spikes
- Prioritize optimization efforts for high-value platforms
- Monitor platform-specific crawl frequency
3. Pages Dashboard
The Pages section reveals how AI platforms interact with your specific content.
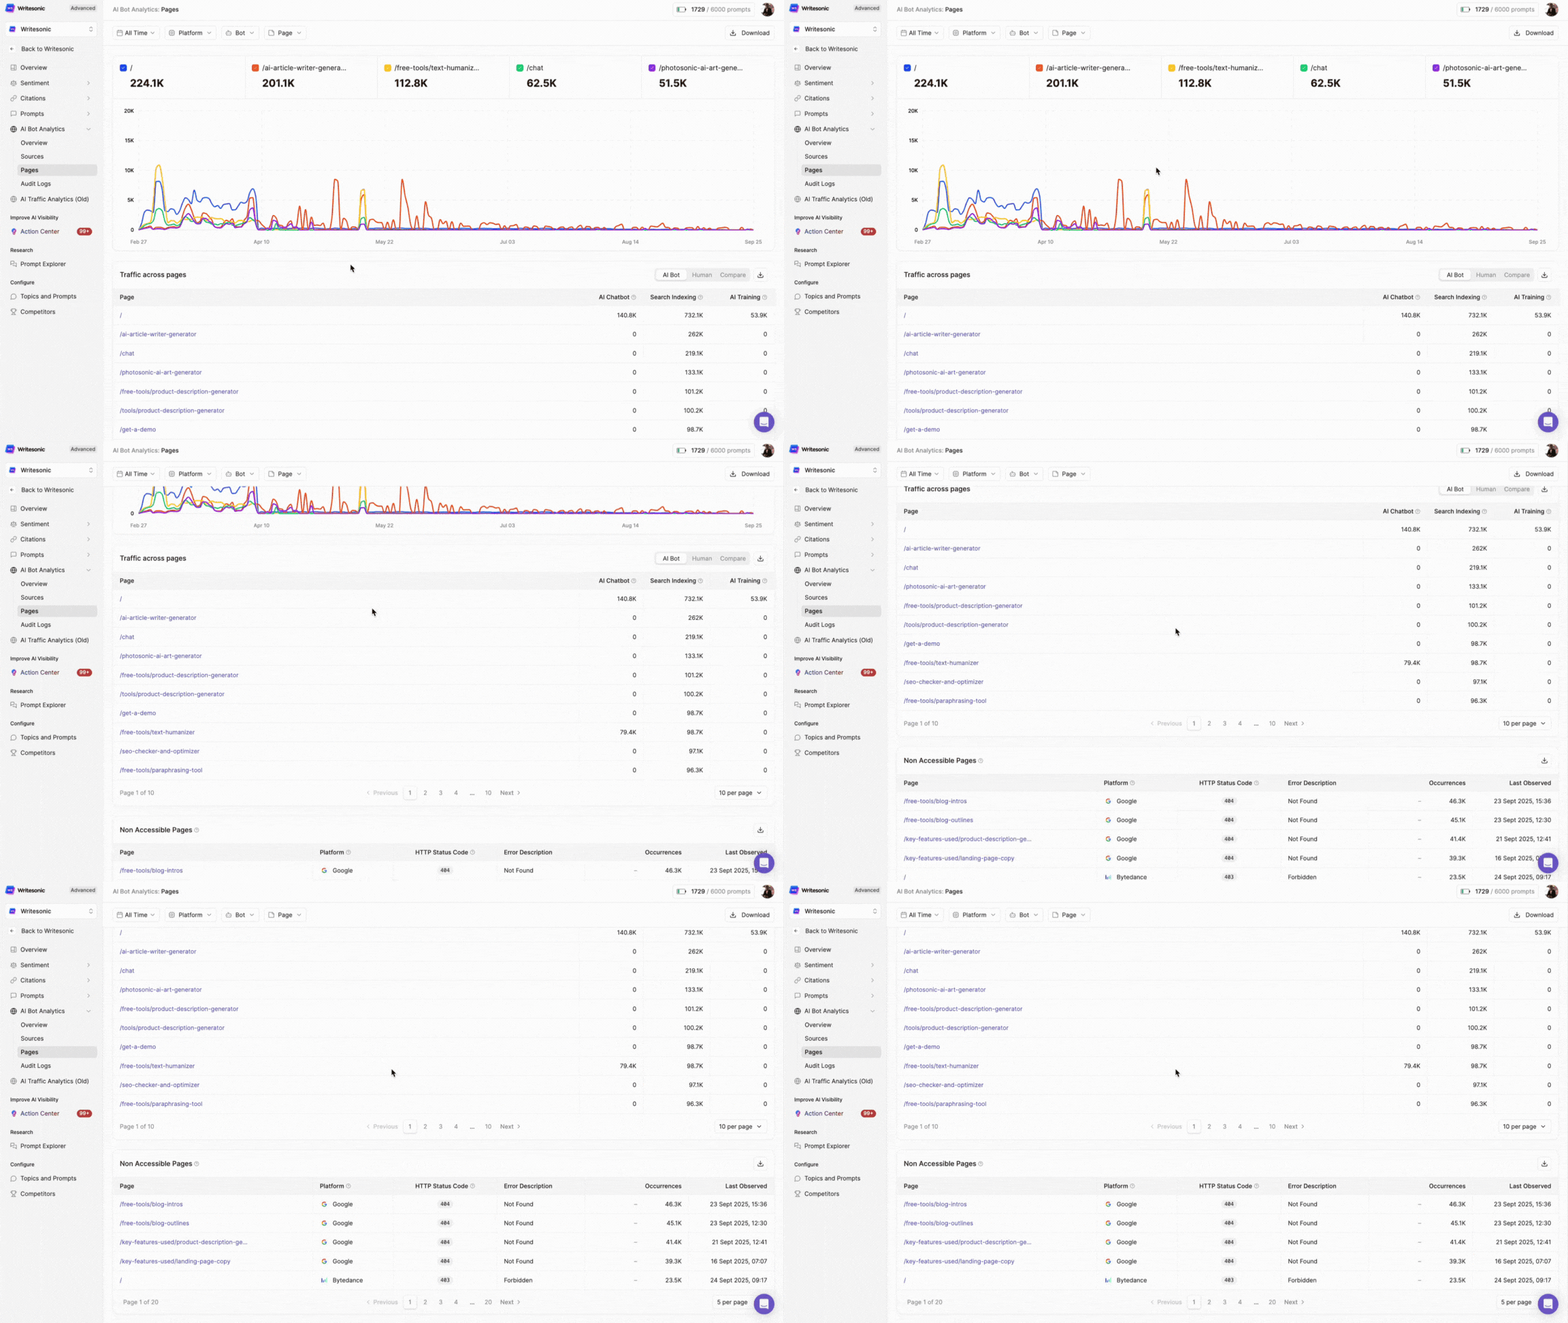
Time-Series Visualization
Track traffic trends for your top-performing pages with color-coded lines for each URL, making it easy to spot content that’s gaining or losing AI attention.
Traffic Across Pages Table
Detailed page-level metrics showing:
-
Page URL: Complete page path
-
AI Chatbot: Visits from conversational AI bots
-
Search Indexing: Crawls for indexing purposes
-
AI Training: Data collection visits
-
Human Visits: Resulting click-through traffic
Strategic Value:
- Identify high-opportunity pages (high bot traffic, low human clicks)
- Find successful content patterns to replicate
- Prioritize technical fixes for valuable pages
Non Accessible Pages
Critical technical health section displaying:
- Page: URLs that bots attempted but failed to access
- Platform: Which AI service encountered the error
- HTTP Status Code: Specific error type (404, 403, 500, etc.)
- Error Description: Plain-language explanation
- Occurrences: Frequency of access failures
- Last Observed: Most recent error timestamp
Action Items:
- Fix robots.txt blocking issues
- Resolve authentication problems
- Address server errors and timeouts
- Update redirect chains
4. Audit Logs
The Audit Logs provide granular, row-level data for every bot interaction with your site.
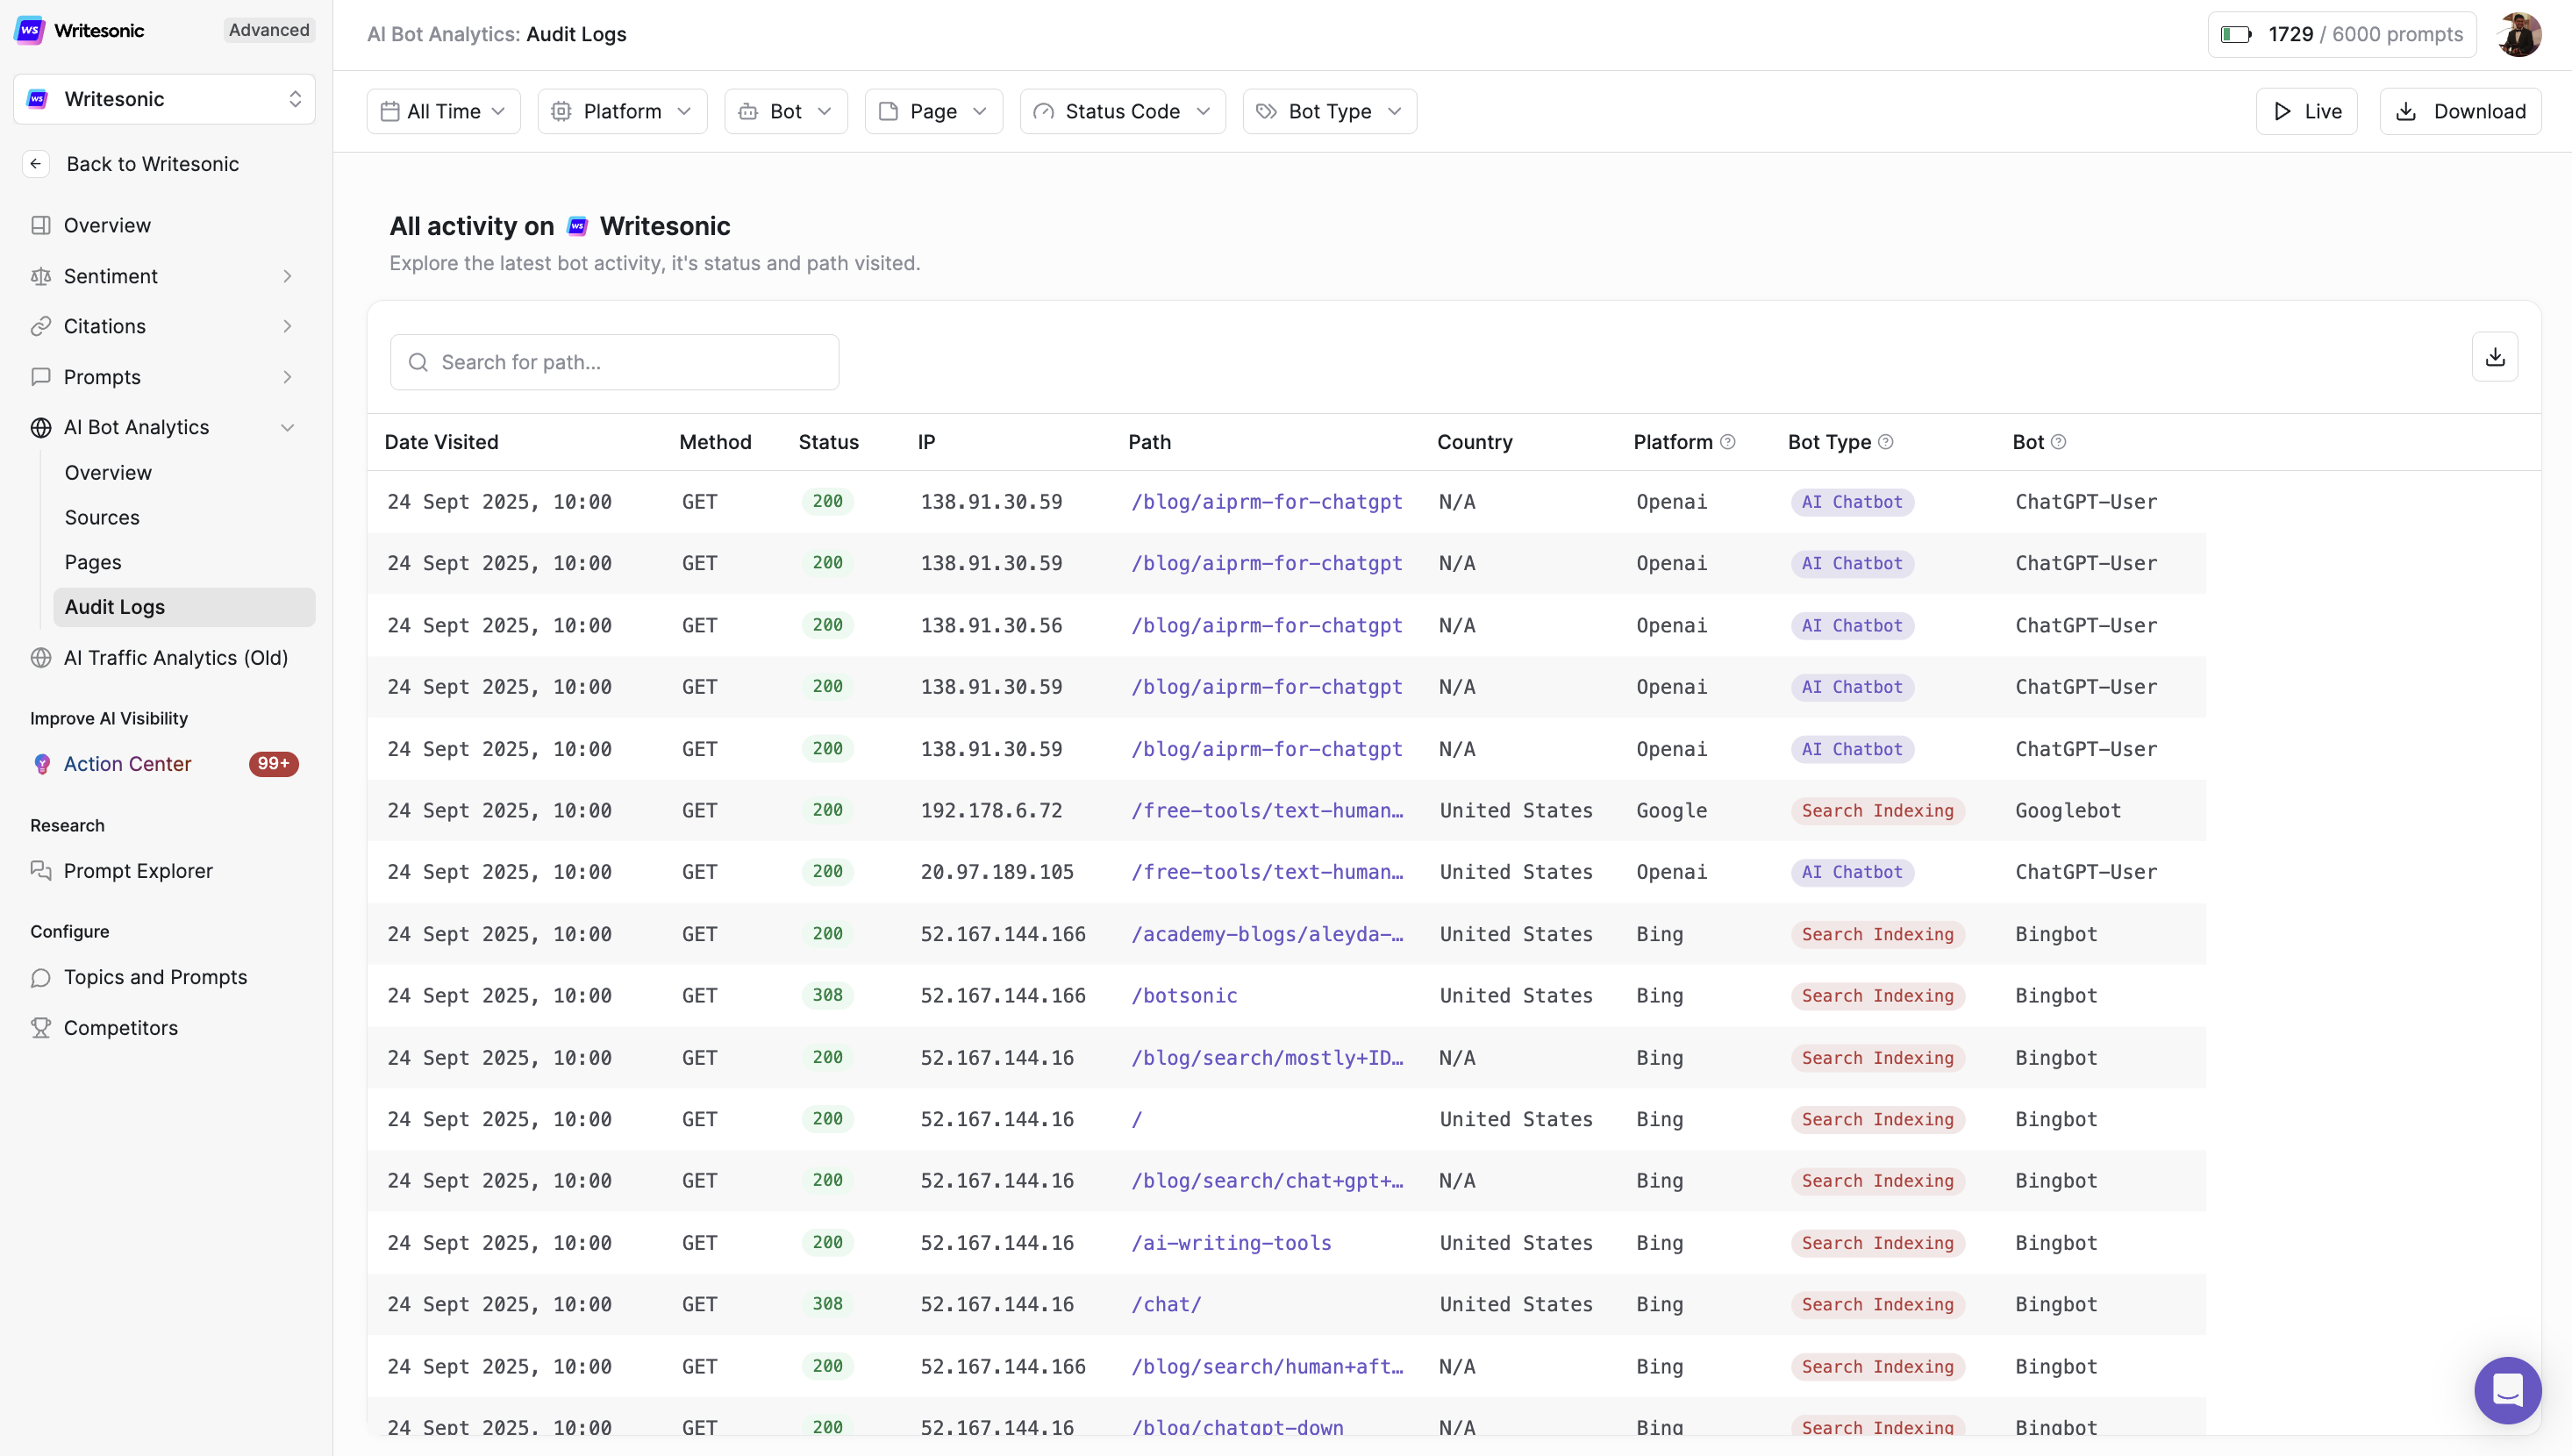
Log Entry Details
Each entry contains:
- Date Visited: Exact timestamp of bot access
- Method: HTTP request type (GET, POST, etc.)
- Status: HTTP response code
- IP: Bot’s IP address
- Path: Exact URL accessed
- Country: Geographic origin
- Platform: AI service name
- Bot Type: Classification category
- Bot: Specific bot identifier
Why It Matters
Up to now, website owners have had a major blind spot in their analytics:
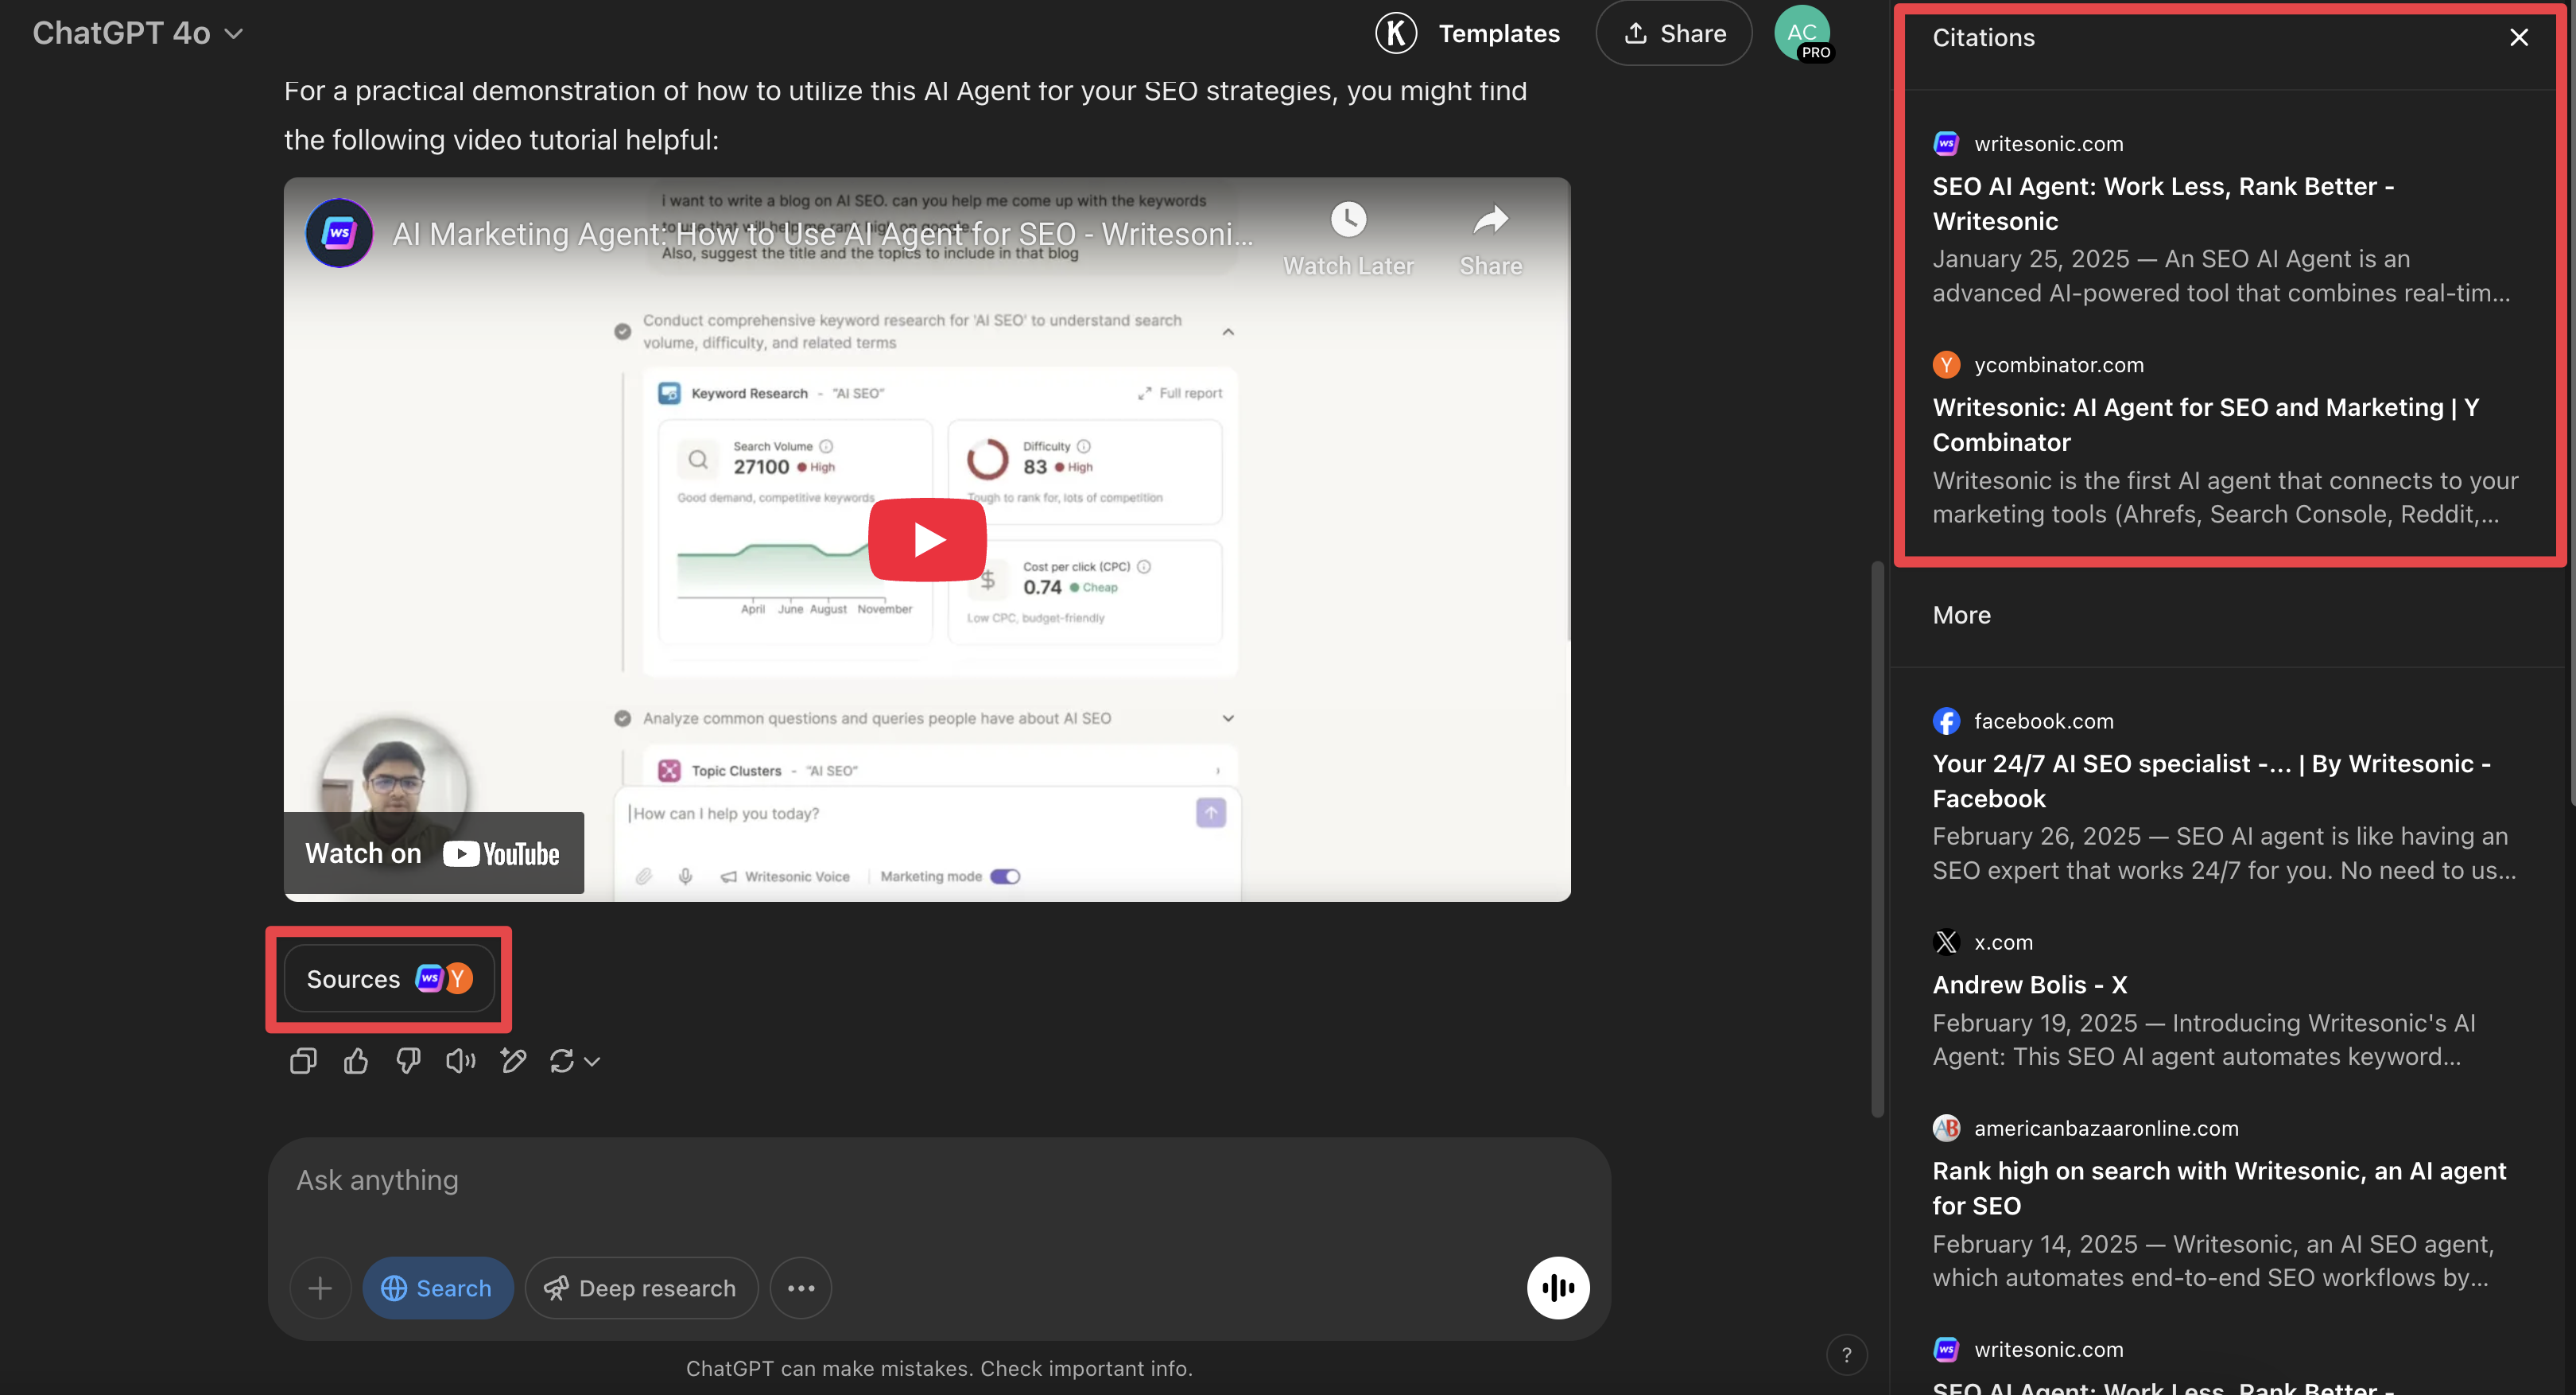
- When someone asks ChatGPT (and other similar AI chat platforms) a question and it reads your content for answers, traditional analytics show nothing
- These "invisible visits" represent a growing portion of your content's actual reach and impact
- Understanding which content AI systems prefer helps you optimize for this emerging channel
- As AI-powered search grows, visibility to these systems becomes as important as Google rankings
Key Features
- Complete AI Crawler Visibility: Track visits from ChatGPT, Claude, Perplexity, Google Gemini, Deepseek, Meta's Llama, and Microsoft Copilot
- Zero Performance Impact: Server-side tracking requires no code on your pages
- Content Performance Analysis: See which pages AI systems visit most frequently
- Platform Breakdown: Understand which AI systems engage most with your content
- Trend Monitoring: Track changes in AI crawler patterns over time
5. Region Dashboard
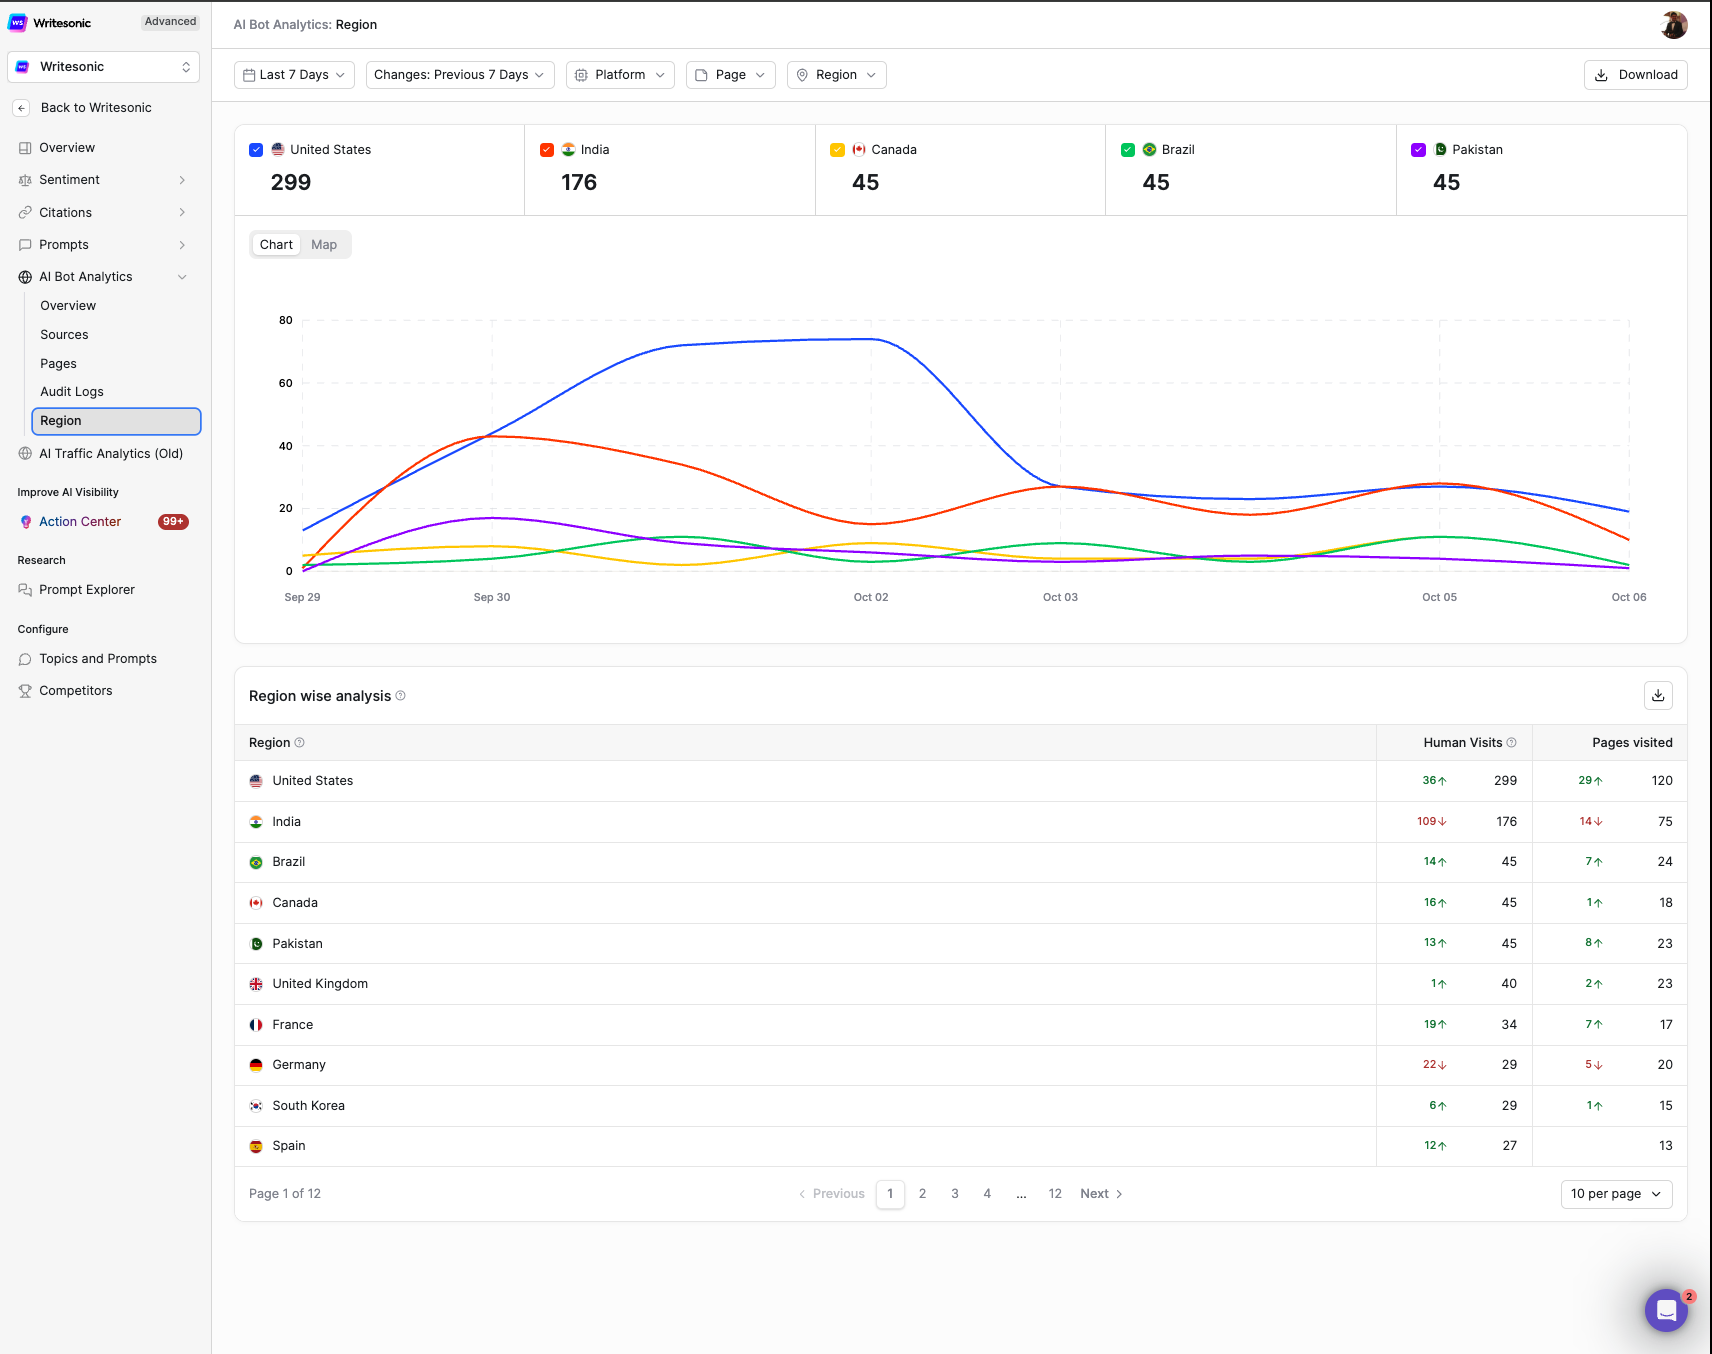
Purpose: Track where in the world real users click through from AI platform citations to visit your site, enabling geographic expansion strategies based on actual human engagement data.
What You’re Looking At
The Region dashboard displays Human visits only
Dashboard Components
1. Top Region Cards
The five countries driving the most human traffic from AI citations, displayed as cards with:
- 🏳️ Country flag and name
- 📊 Visit count (large number)
- 📈 Trend indicator (growth/decline from previous period)
How to use: Quick health check - are your target markets in the top 5?
2. Control Bar
- Time Period Selector: “Last 7 Days” with dropdown for “Previous 7 Days” comparison
- Platform Filter: Isolate traffic from specific AI platforms
- Page Filter: Analyze regional performance for specific content
- Region Filter: Focus on particular countries or regions
How to use: Drill down to answer specific questions like “Which countries engage most with our product pages via ChatGPT?”
3. Visualization Toggle (Chart/Map)
Chart View - Time Trends
- What it shows: Line graph of human visits over time by country
- Best for: Spotting trends, peaks, and regional patterns
- Key features:
- Each country gets a unique color matching its flag
- Hover for exact daily numbers
- Identify which regions are growing vs. declining
Map View - Geographic Distribution
- What it shows: Global heat map of traffic concentration
- Best for: Identifying geographic clusters and gaps
- Key features:
- Darker blue = more traffic
- Zoom controls (+/-) for regional focus
- 0-100% concentration scale
How to use: Start with Map for overview, switch to Chart for trend analysis
4. Regional Performance Table
Columns explained:
- Region: Country with flag icon
- Human Visits: Absolute number + percentage of global total
- Pages Visited: Average pages per session + change from previous period
- Growth Indicators: Green ↑ for growth, red ↓ for decline
Reading the data:
- High visits + High pages = Strong market engagement
- Growing visits + Low pages = Emerging opportunity, needs optimization
- Declining visits = Investigate causes (competition, technical issues, content relevance)
Getting Started
To begin tracking AI traffic to your website:
How It's Different from Traditional Analytics
| Traditional Analytics (Google Analytics) | AI Traffic Analytics |
|---|---|
| Relies on JavaScript that AI crawlers don't execute | Works at the server level, capturing all AI visits |
| Misses AI visits completely | Captures and categorizes all AI crawler activity |
| Only tracks human visitors | Reveals both AI and human traffic patterns |
| No differentiation between AI platforms | Detailed breakdown by specific AI system |
| Limited to standard web metrics | Specialized metrics for AI visibility |
FAQs
Q: What’s the difference between bot visits and human visits?
A: Bot visits are automated crawls by AI platforms to fetch and optionally index your content. Human visits are real users who clicked through to your site after seeing your content cited in an AI-generated answer. The relationship between these metrics indicates how effectively your content converts AI exposure into actual traffic.
Q: How is click rate calculated and what’s a good benchmark?
A: Click rate is (Human Visits / Bot Visits) × 100. Industry benchmarks vary, but rates above 5% indicate strong performance.
Q: Why are some of my pages showing in “Non Accessible Pages”?
A: Pages appear here when bots encounter errors trying to access them. Common causes include robots.txt blocking, authentication requirements, server timeouts, broken links, or rate limiting. Each entry shows the specific error code.
Q: What does a high bot error rate indicate?
A: A bot error rate above 5% suggests technical issues preventing AI platforms from properly accessing your content. This directly impacts your AI visibility and potential traffic. Review your audit logs to identify patterns and prioritize fixes.
Q: Can I see which specific AI answers cited my content?
A: The current version tracks citation-driven traffic at the platform and page level. While we can’t show the exact AI responses, the combination of bot visits, human visits, and click rates provides actionable insights about citation performance.
Q: What’s the difference between AI Chatbot, Search Indexing, and AI Training bots?
A:
- AI Chatbot bots fetch content in real-time to answer user queries immediately
- Search Indexing bots build databases for future query retrieval
- AI Training bots collect data to improve model capabilities and used for training future models
Q: How should I prioritize optimization efforts?
A: Focus on three areas:
-
High-error pages: Fix technical issues blocking bot access
-
High bot/low human pages: Improve titles, snippets, and structured data
-
Server side rendering: Do server side rendering instead of client side
Q: How can I improve my click rate from AI citations?
A:
-
Optimize page titles and meta descriptions for clarity and relevance
-
Implement comprehensive structured data markup
-
Ensure fast page load speeds
-
Create content that directly answers common queries
-
Fix all technical errors preventing proper indexing
-
Do server side rendering instead of client side
Q: How do I use Audit Logs for debugging?
A: Filter audit logs by status code to find all errors, then search for specific paths to understand failure patterns. Check timestamps to correlate with any changes you made. Use IP and country data to identify regional issues or unexpected bot behavior.
Updated 2 months ago
