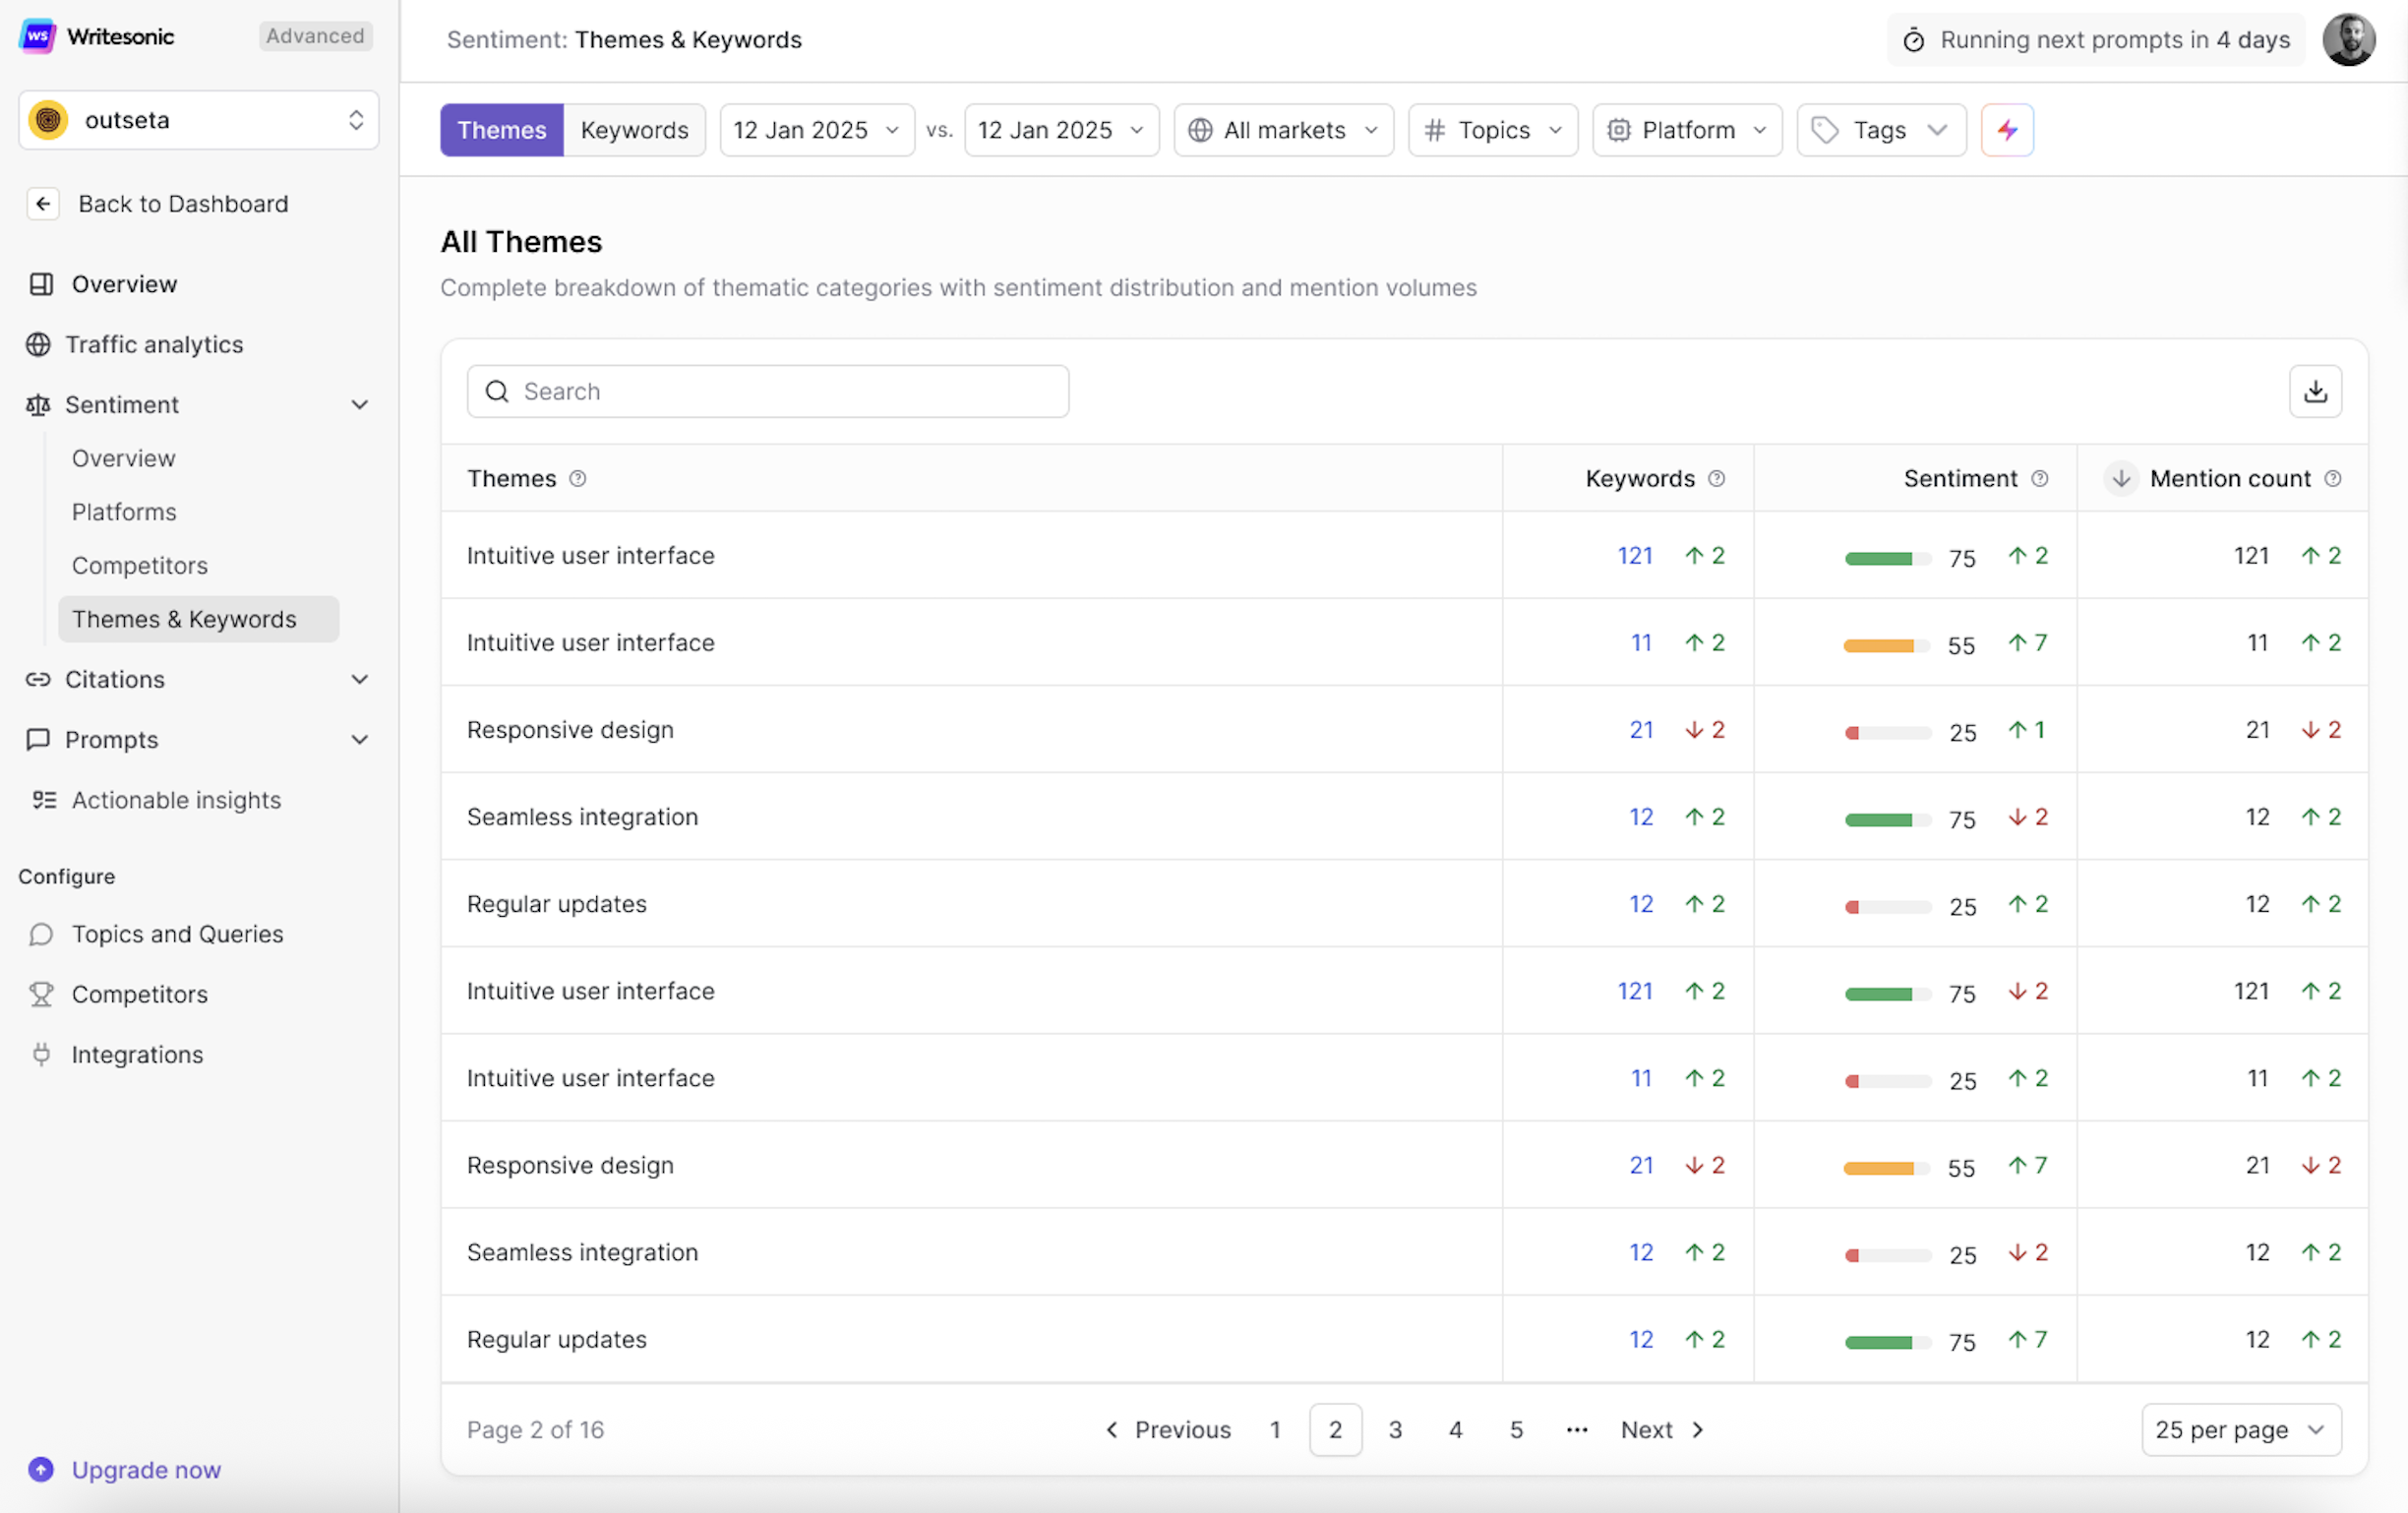
Sentiment: Themes and Keywords
The Themes & Keywords page gives you a fast, at-a-glance view of how AI platforms talk about your brand — and whether that conversation is positive or negative.
It works by grouping AI-generated answers into recurring themes (topics that keep showing up) and drilling down into the specific keywords driving sentiment within each theme. Use it to spot what's resonating, what's hurting, and where you need to focus next.

How to Read This Page
The page has two main views, controlled by the toggle at the top:
- Themes — Groups AI mentions into broad thematic categories (e.g., "Intuitive user interface," "Responsive design," "Seamless integration").
- Keywords — Shows the individual keywords that drive sentiment within those themes, along with the specific AI platforms where they appear.
Switch between the two views using the Themes / Keywords toggle at the top of the page.
Filters and Controls
Before diving into the data, you can narrow down what you see using the filter bar at the top. These filters apply to both the Themes and Keywords views.

- Date Range — Select a start and comparison date to track how themes and keywords have shifted over time. Trending indicators (↑/↓) throughout the table reflect changes between these two periods.
- Markets — Filter by a specific market if you're tracking multiple regions or languages.
- Topics — Narrow results to a specific topic from your configured GEO topics.
- Platform — Filter by a specific AI platform (e.g., ChatGPT, Perplexity, Gemini) to see platform-specific sentiment patterns.
- Tags — Apply custom tags to further refine the data based on your internal categorizations.
Themes View
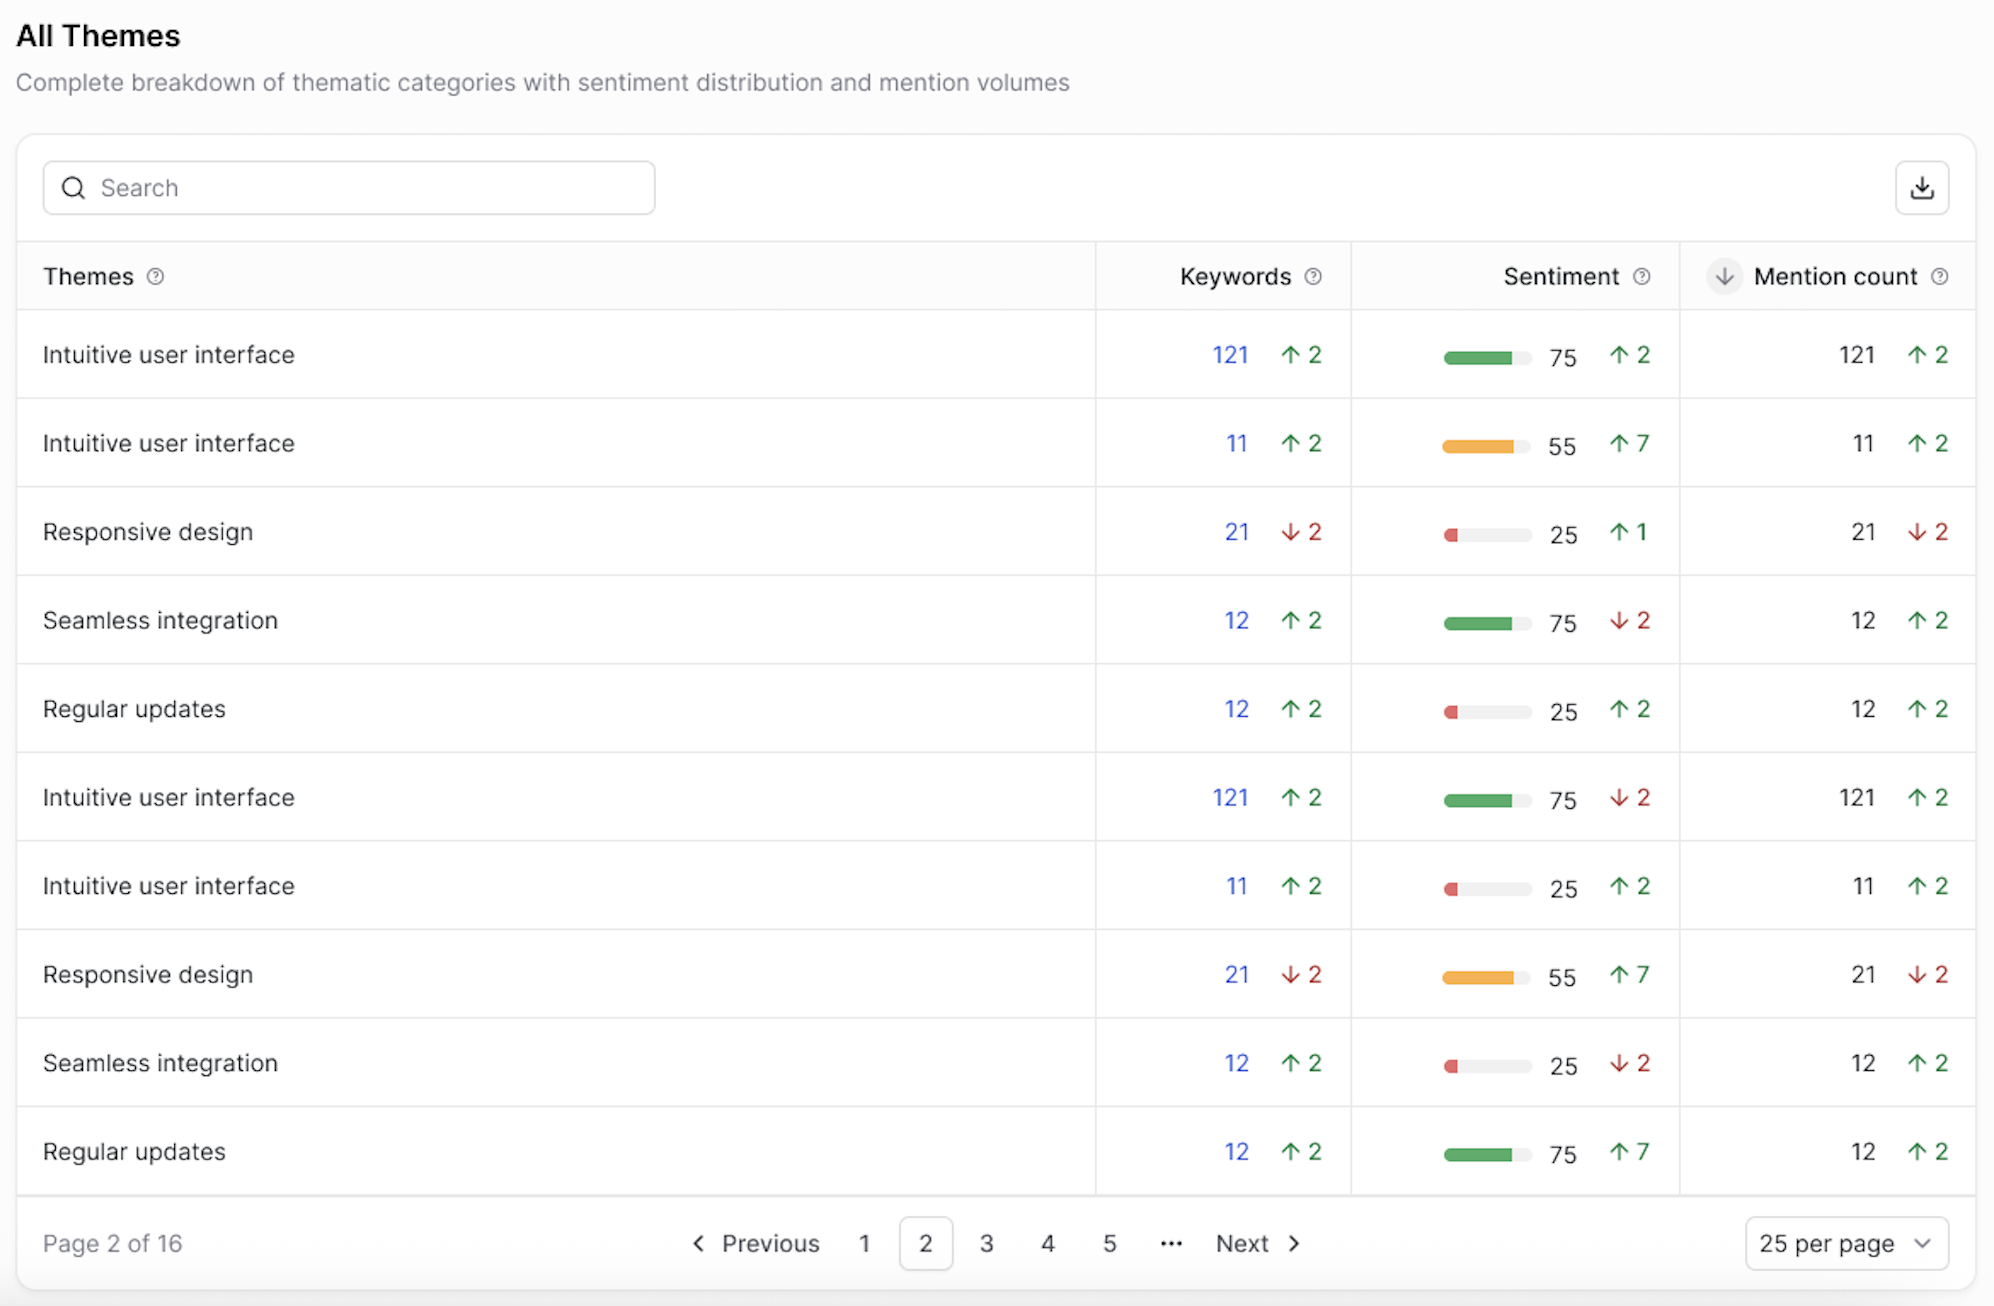
The Themes view displays a complete breakdown of thematic categories with sentiment distribution and mention volumes. Think of themes as the big-picture topics AI engines associate with your brand.
What You'll See in the Table
Each row in the All Themes table represents a recurring theme, with the following columns:
- Themes — The name of the thematic category (e.g., "Intuitive user interface," "Regular updates"). These are automatically identified from AI-generated answers to your tracked prompts.
- Keywords — The number of individual keywords associated with this theme. Click the count to explore the specific terms driving this theme. The trending indicator (↑/↓) shows whether the keyword count has increased or decreased compared to the previous period.
- Sentiment — A visual sentiment bar with a numerical score representing the percentage of positive mentions. Green indicates strong positive sentiment, yellow is mixed, and red signals predominantly negative sentiment. The trending indicator reflects whether sentiment is improving or declining.
- Mention Count — The total number of times this theme appeared across AI-generated answers. The trending indicator shows whether the theme is being discussed more or less frequently.
Why Themes Matter
- Spot brand strengths — Themes with high sentiment scores and high mention counts represent what AI platforms consistently praise about your brand.
- Identify problem areas — Themes with low sentiment but high mention counts are actively being discussed in a negative light — these need immediate attention.
- Track perception shifts — Use the date comparison to see if your content updates, campaigns, or product changes are moving the needle on specific themes.
How to Use It
Look for themes that have a high mention count but low sentiment score. These are high-visibility areas where your brand is frequently discussed but not positively perceived — representing both a risk and an opportunity. Prioritize addressing these through content improvements, product updates, or targeted messaging.
Keywords View
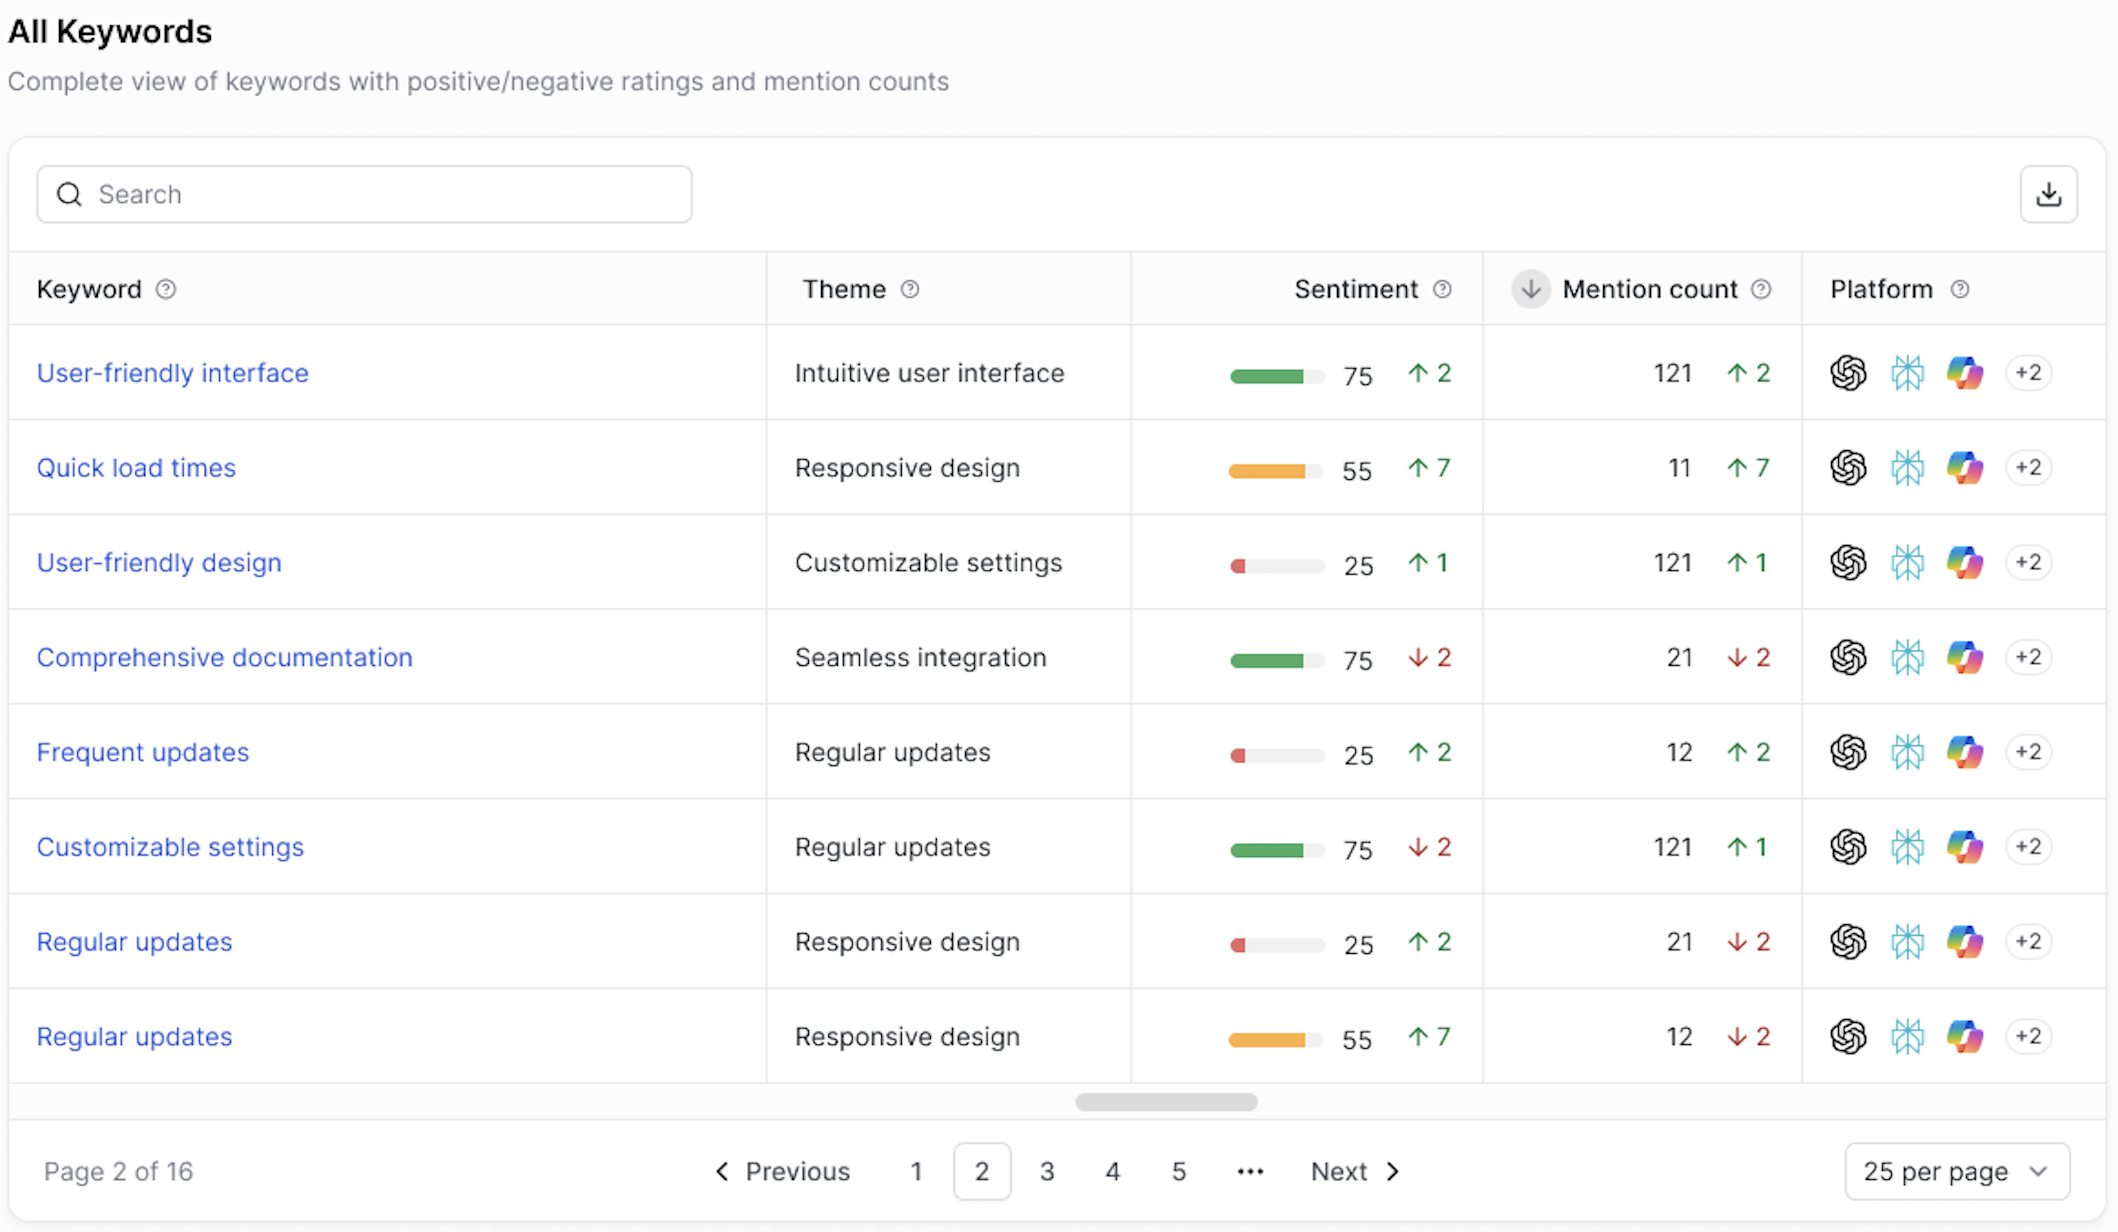
The Keywords view gives you a granular look at the specific terms AI platforms use when discussing your brand. While Themes show you the big picture, Keywords show you the exact language driving sentiment.
What You'll See in the Table
Each row in the All Keywords table represents an individual keyword, with the following columns:
- Keyword — The specific term extracted from AI-generated answers (e.g., "User-friendly interface," "Quick load times," "Comprehensive documentation"). Keywords are clickable for deeper exploration.
- Theme — The parent thematic category this keyword belongs to. This helps you understand the broader context behind each keyword.
- Sentiment — A visual sentiment bar with a numerical score, same as the Themes view. The trending indicator shows whether sentiment for this specific keyword is improving or declining.
- Mention Count — How many times this keyword appeared in AI-generated answers. The trending indicator reflects volume changes over time.
- Platform — Icons showing which AI platforms are using this keyword when discussing your brand (e.g., ChatGPT, Perplexity, Gemini, Google AI Mode, and others). This tells you where specific perceptions are forming.
Why Keywords Matter
- Understand the exact language AI uses — Keywords reveal precisely how AI engines describe your brand, which may differ from your own messaging.
- Discover platform-specific patterns — A keyword might appear frequently on one platform but not another. This helps you tailor your content strategy per platform.
- Connect sentiment to specifics — Instead of knowing a theme is "negative," you can see exactly which terms are driving that negativity.
How to Use It
Pay close attention to negative-sentiment keywords with high mention counts. These are the specific terms pulling your brand perception down. Cross-reference with the Platform column to identify if the issue is widespread or isolated to a specific AI engine — then prioritize your content and messaging strategy accordingly.
Searching and Exporting
Both views include:
- Search bar — Quickly find a specific theme or keyword by typing in the search field at the top of the table.
- Export — Click the download icon (top-right of the table) to export the data for reporting, stakeholder presentations, or deeper analysis.
- Pagination — Navigate through results using the pagination controls at the bottom. You can adjust the number of items displayed per page (default: 25 per page).
Tips for Getting the Most Out of This Page
- Start with Themes, then drill into Keywords. Themes give you the strategic overview. Keywords give you the tactical detail. Use both together to build a complete picture.
- Compare date ranges regularly. Sentiment shifts over time. Set a weekly or bi-weekly cadence to track whether your GEO efforts are improving brand perception.
- Filter by Platform when investigating issues. If a theme has mixed sentiment, filtering by platform can reveal whether the problem is universal or specific to one AI engine.
- Use Keywords to inform your content strategy. If AI platforms consistently associate your brand with a negative keyword, create or update content that directly addresses that concern.
- Cross-reference with the Competitors page. Understanding how competitors perform on the same themes gives you context for whether a sentiment issue is brand-specific or industry-wide.
Updated 5 months ago