Citations: Your Content Performance
Track how your website pages perform when cited by AI — and see exactly where you stand against competitors.
When AI engines like ChatGPT, Google AI Overviews, Perplexity, and others generate answers, they often pull from and cite specific webpages as sources. The Your Content Performance page gives you a complete picture of how your own content is performing in those citations — including which pages are being cited, how often, on which platforms, and how your citation share compares to competitors.
Use this page to identify your top-performing content, spot competitive gaps, and take targeted action to grow your brand's presence in AI-generated answers.
Global Filters
Before diving into the data, you can refine your view using the filter bar at the top of the page. These filters apply across all sections on the page:

- Date range: Select a custom or preset date range to analyze performance over a specific period. You can also compare against a previous period.
- Markets: Filter by specific geographic markets you've configured.
- Topics: Narrow results to specific topics relevant to your business.
- Platform: Isolate data by AI platform (e.g., ChatGPT, Perplexity, Google AI Overviews, etc.).
- Brand mentions: Filter to see only results where your brand is explicitly mentioned.
- Prompt type: Filter by the type of prompt driving the citation.
All metrics, charts, and tables on the page update instantly when you adjust these filters.
Quick-Look Metrics
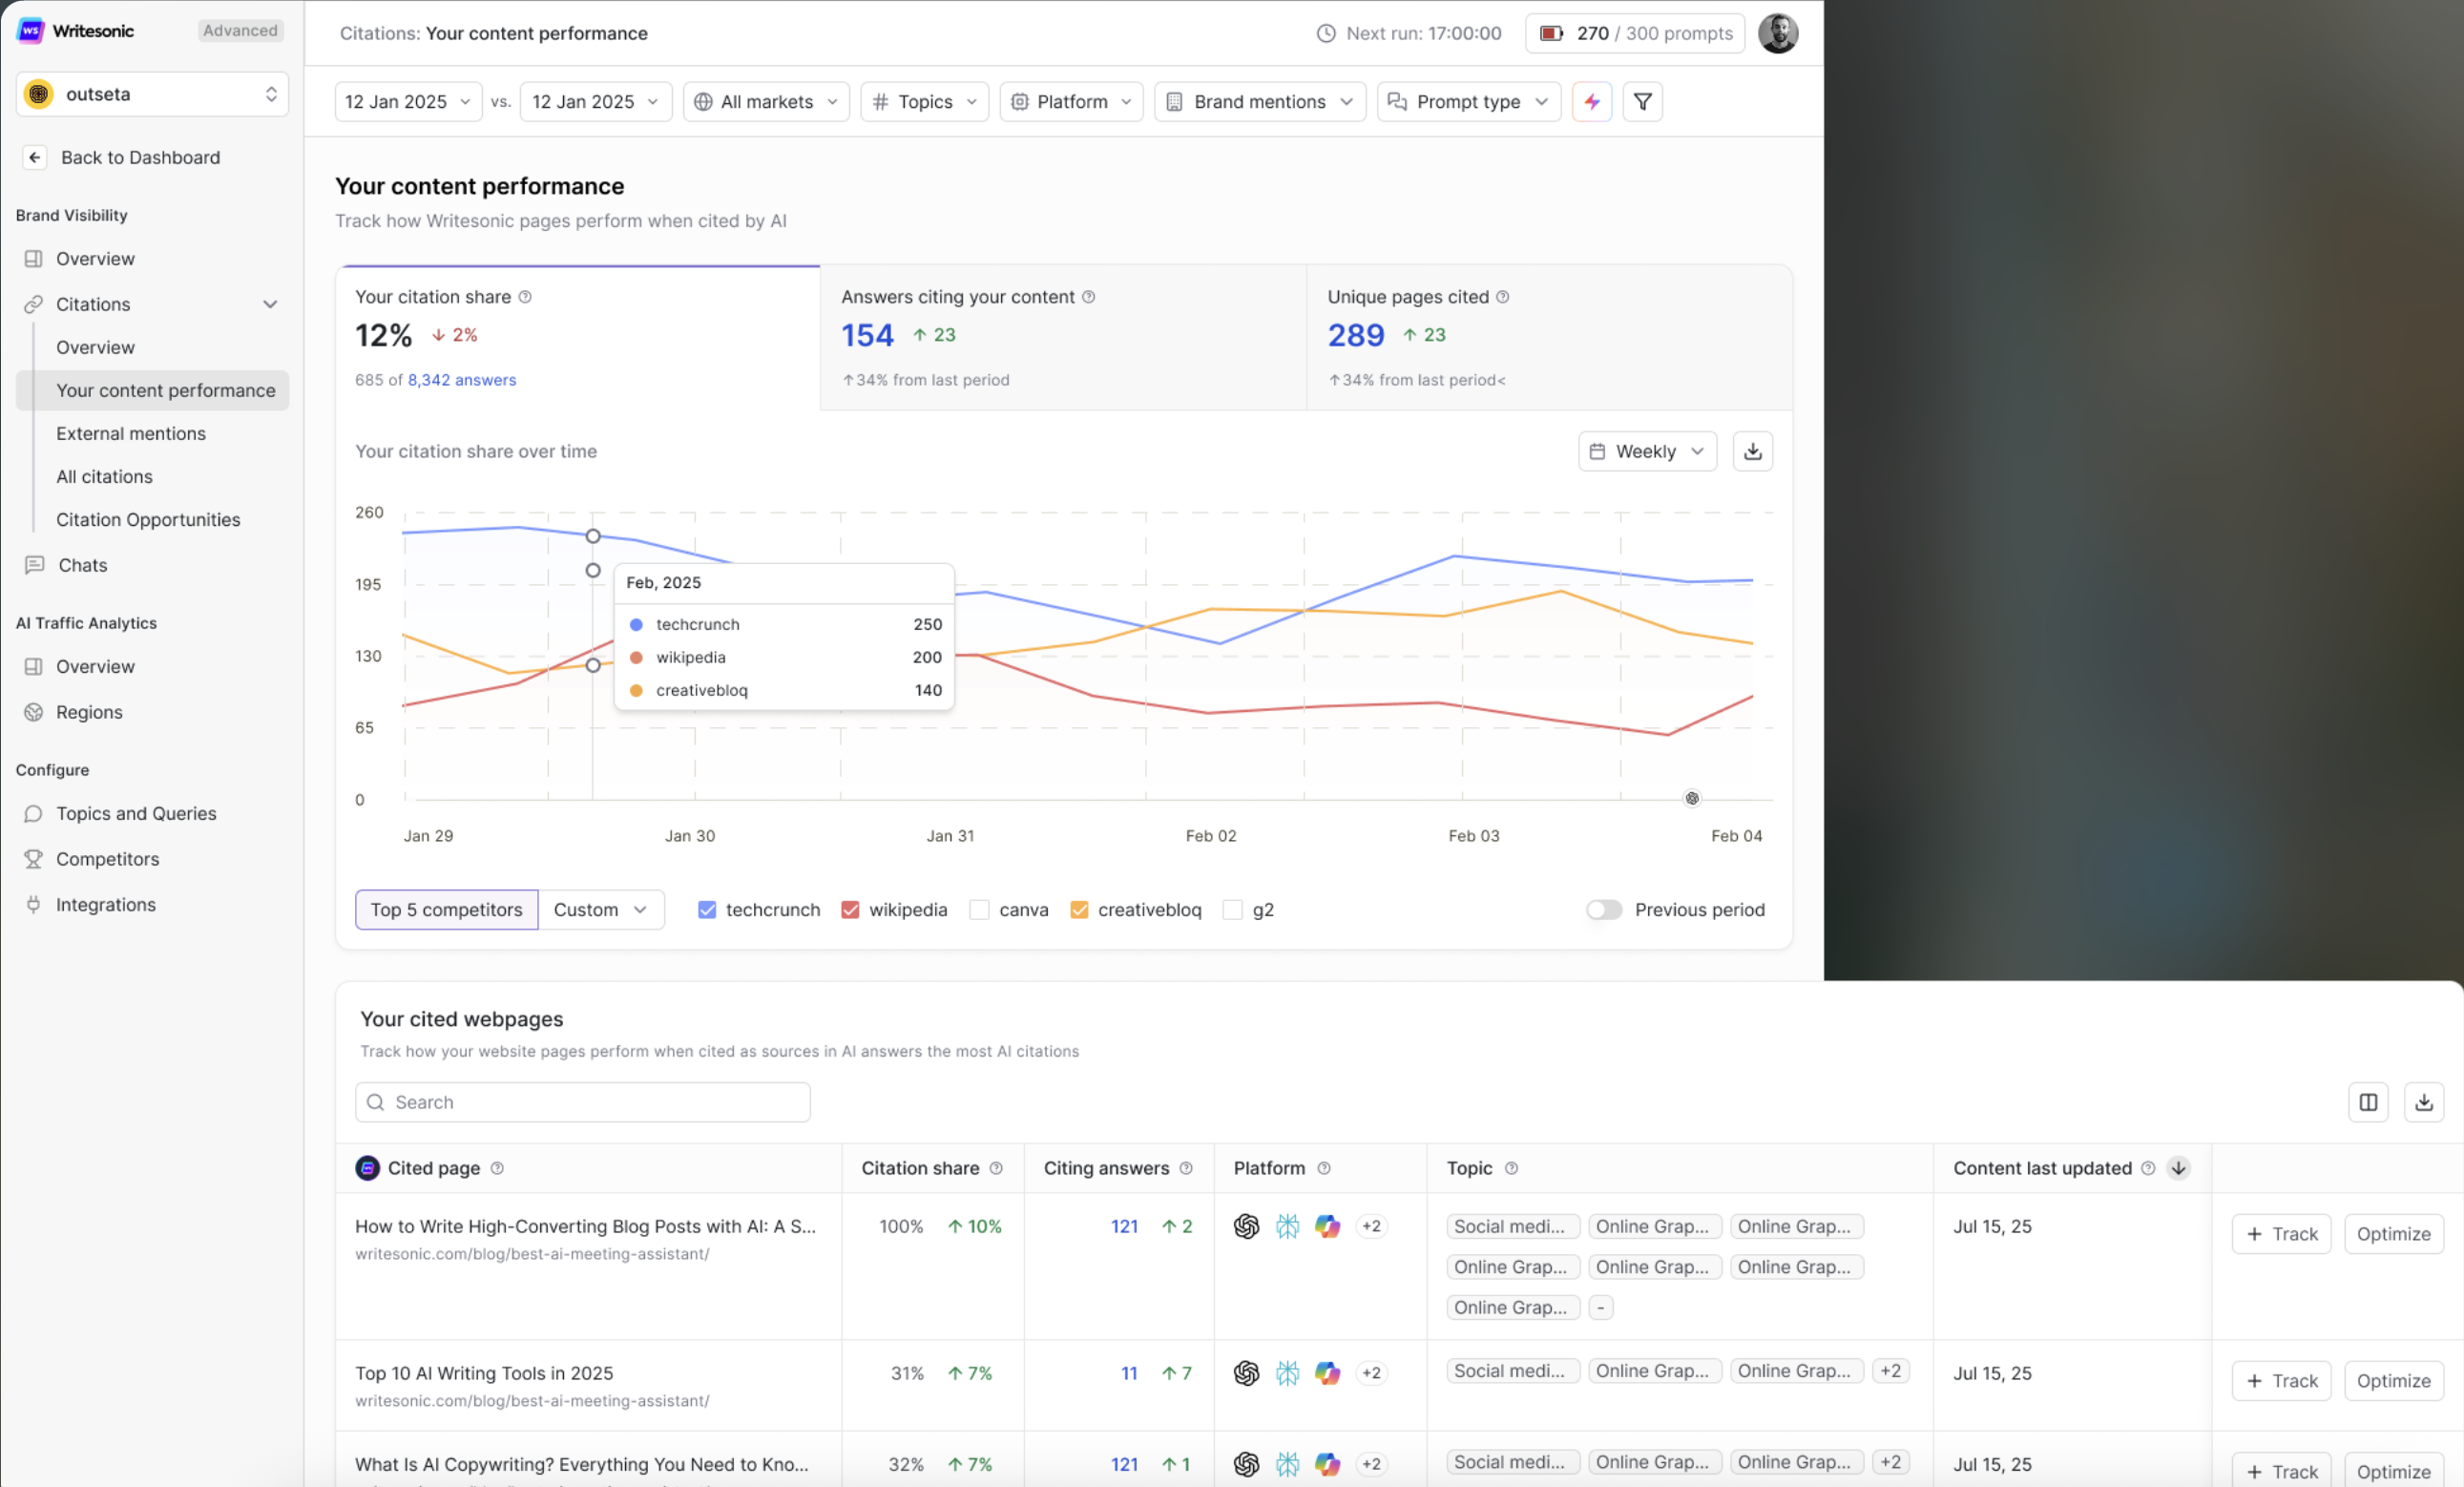
At the top of the page, three headline metrics give you an instant snapshot of your citation performance:
- Your citation share — The percentage of total AI citations (across all tracked answers) that reference your domain. This is shown alongside the total number of answers being tracked. A change indicator (e.g., ↑ or ↓) shows how this has shifted compared to the previous period.
- Answers citing your content — The total number of AI-generated answers that included at least one citation to your website. The change indicator shows growth or decline from the last period, along with the percentage shift.
- Unique pages cited — The number of distinct pages from your site that were cited as sources across AI answers. A rising number here means AI engines are pulling from a broader range of your content.
These metrics are your starting point. If citation share is growing, your content strategy is working. If it's flat or declining, dig deeper into the sections below.
Your Citation Share Over Time
This trend chart visualizes how your citation volume compares to your top competitors over the selected date range.
- Y-axis: Number of citations.
- X-axis: Time (days or weeks, depending on the selected range).
- Each competitor is represented by a color-coded line, making it easy to spot who's gaining or losing ground.
Key controls:
- Toggle between Top 5 competitors and a Custom selection to choose which competitors appear on the chart.
- Switch between Weekly and other time granularities for different levels of detail.
- Enable Previous period comparison to overlay past performance.
- Download the chart data for reporting or further analysis.
How to use this: Look for sustained upward trends in your line relative to competitors. If a competitor's citation count is climbing while yours is flat, drill into the Your Cited Webpages table below to understand what content they may be winning with — and where you can improve.
Your Cited Webpages
This is the core table on the page. It shows every page from your website that has been cited as a source in AI-generated answers, along with detailed performance data for each.
Columns include:
- Cited page — The URL and title of your page that was cited. Click to open.
- Citation share — The percentage of total citations that this specific page accounts for, with a change indicator showing the trend.
- Citing answers — The number of AI answers that cited this page, along with the change from the previous period.
- Platform — Icons showing which AI platforms cited the page (e.g., ChatGPT, Perplexity, Google, etc.), plus a count if cited on additional platforms.
- Topic — The topic categories associated with the prompts that triggered citations to this page.
- Content last updated — The date when the content on this page was last refreshed. AI engines tend to favor up-to-date sources, so this is an important signal.
Actions available per page:
- + Track — Add this page to your tracked pages for ongoing monitoring.
- Optimize — Jump directly to content optimization recommendations for this page.
Additional features:
- Use the Search bar to find specific pages quickly.
- Sort by any column to surface your top-performing or underperforming pages.
- Toggle between list and grid views using the view icons.
- Download the table data for offline analysis.
- Pagination controls let you navigate through all your cited pages, with customizable results per page.
How to use this: Sort by Citing answers to find your strongest pages. These are your citation champions — keep them fresh and authoritative. Sort by Citation share (declining) to spot pages losing ground, and use the Optimize action to get specific improvement recommendations.
Prompts Citing Your Pages
This section reveals the actual prompts (questions and queries) that drove AI platforms to cite your pages. It connects the dots between what people are asking AI and which of your pages are being used as sources.
Columns include:
- Prompt — The exact question or query that triggered a citation to your content.
- Pages cited — The number of your pages cited in response to this prompt, with a change indicator.
- Citation share — Your share of citations for this specific prompt, with trend data.
- Citing answers — How many AI answers for this prompt cited your content, with change tracking.
- AI search volume — The estimated search volume for this prompt across AI platforms, helping you gauge demand.
- Platform — Which AI platforms generated answers citing your content for this prompt.
- Market — The geographic market and language where this prompt was tracked, shown with a country flag.
- Intent — The intent classification of the prompt (e.g., N for Navigational, C for Commercial, T for Transactional, I for Informational).
- Type — Whether the prompt is Branded (includes your brand name) or Non-branded (generic/category queries).
- Topic — The topic category this prompt falls under.
Additional features:
- Search to find specific prompts.
- Sort by any column to prioritize by volume, citation share, or other metrics.
- Download the data for reporting.
- Pagination controls for navigating large prompt lists.
How to use this: Pay close attention to non-branded prompts with high AI search volume where you have citation share. These represent organic discovery opportunities — people finding your content without searching for your brand directly. If you spot high-volume prompts where your citation share is low, prioritize content creation or optimization for those topics.
Optimization Tips
- Keep your top-cited pages fresh. AI engines favor up-to-date content. Regularly refresh pages that are already earning citations — update data, add new insights, and ensure accuracy.
- Close competitive gaps. If competitors are dominating citation share for specific topics or prompts, analyze their cited content and create stronger, more authoritative pages to compete.
- Focus on non-branded prompts. Earning citations on generic, category-level queries builds broader brand awareness and captures users who haven't heard of you yet.
- Track and optimize consistently. Use the + Track and Optimize actions on individual pages to build a systematic content improvement workflow.
- Monitor prompt intent. Informational prompts help build awareness, while commercial and transactional prompts drive higher-value traffic. Balance your content strategy across intent types.
Updated 5 months ago