Overview Page
Overview
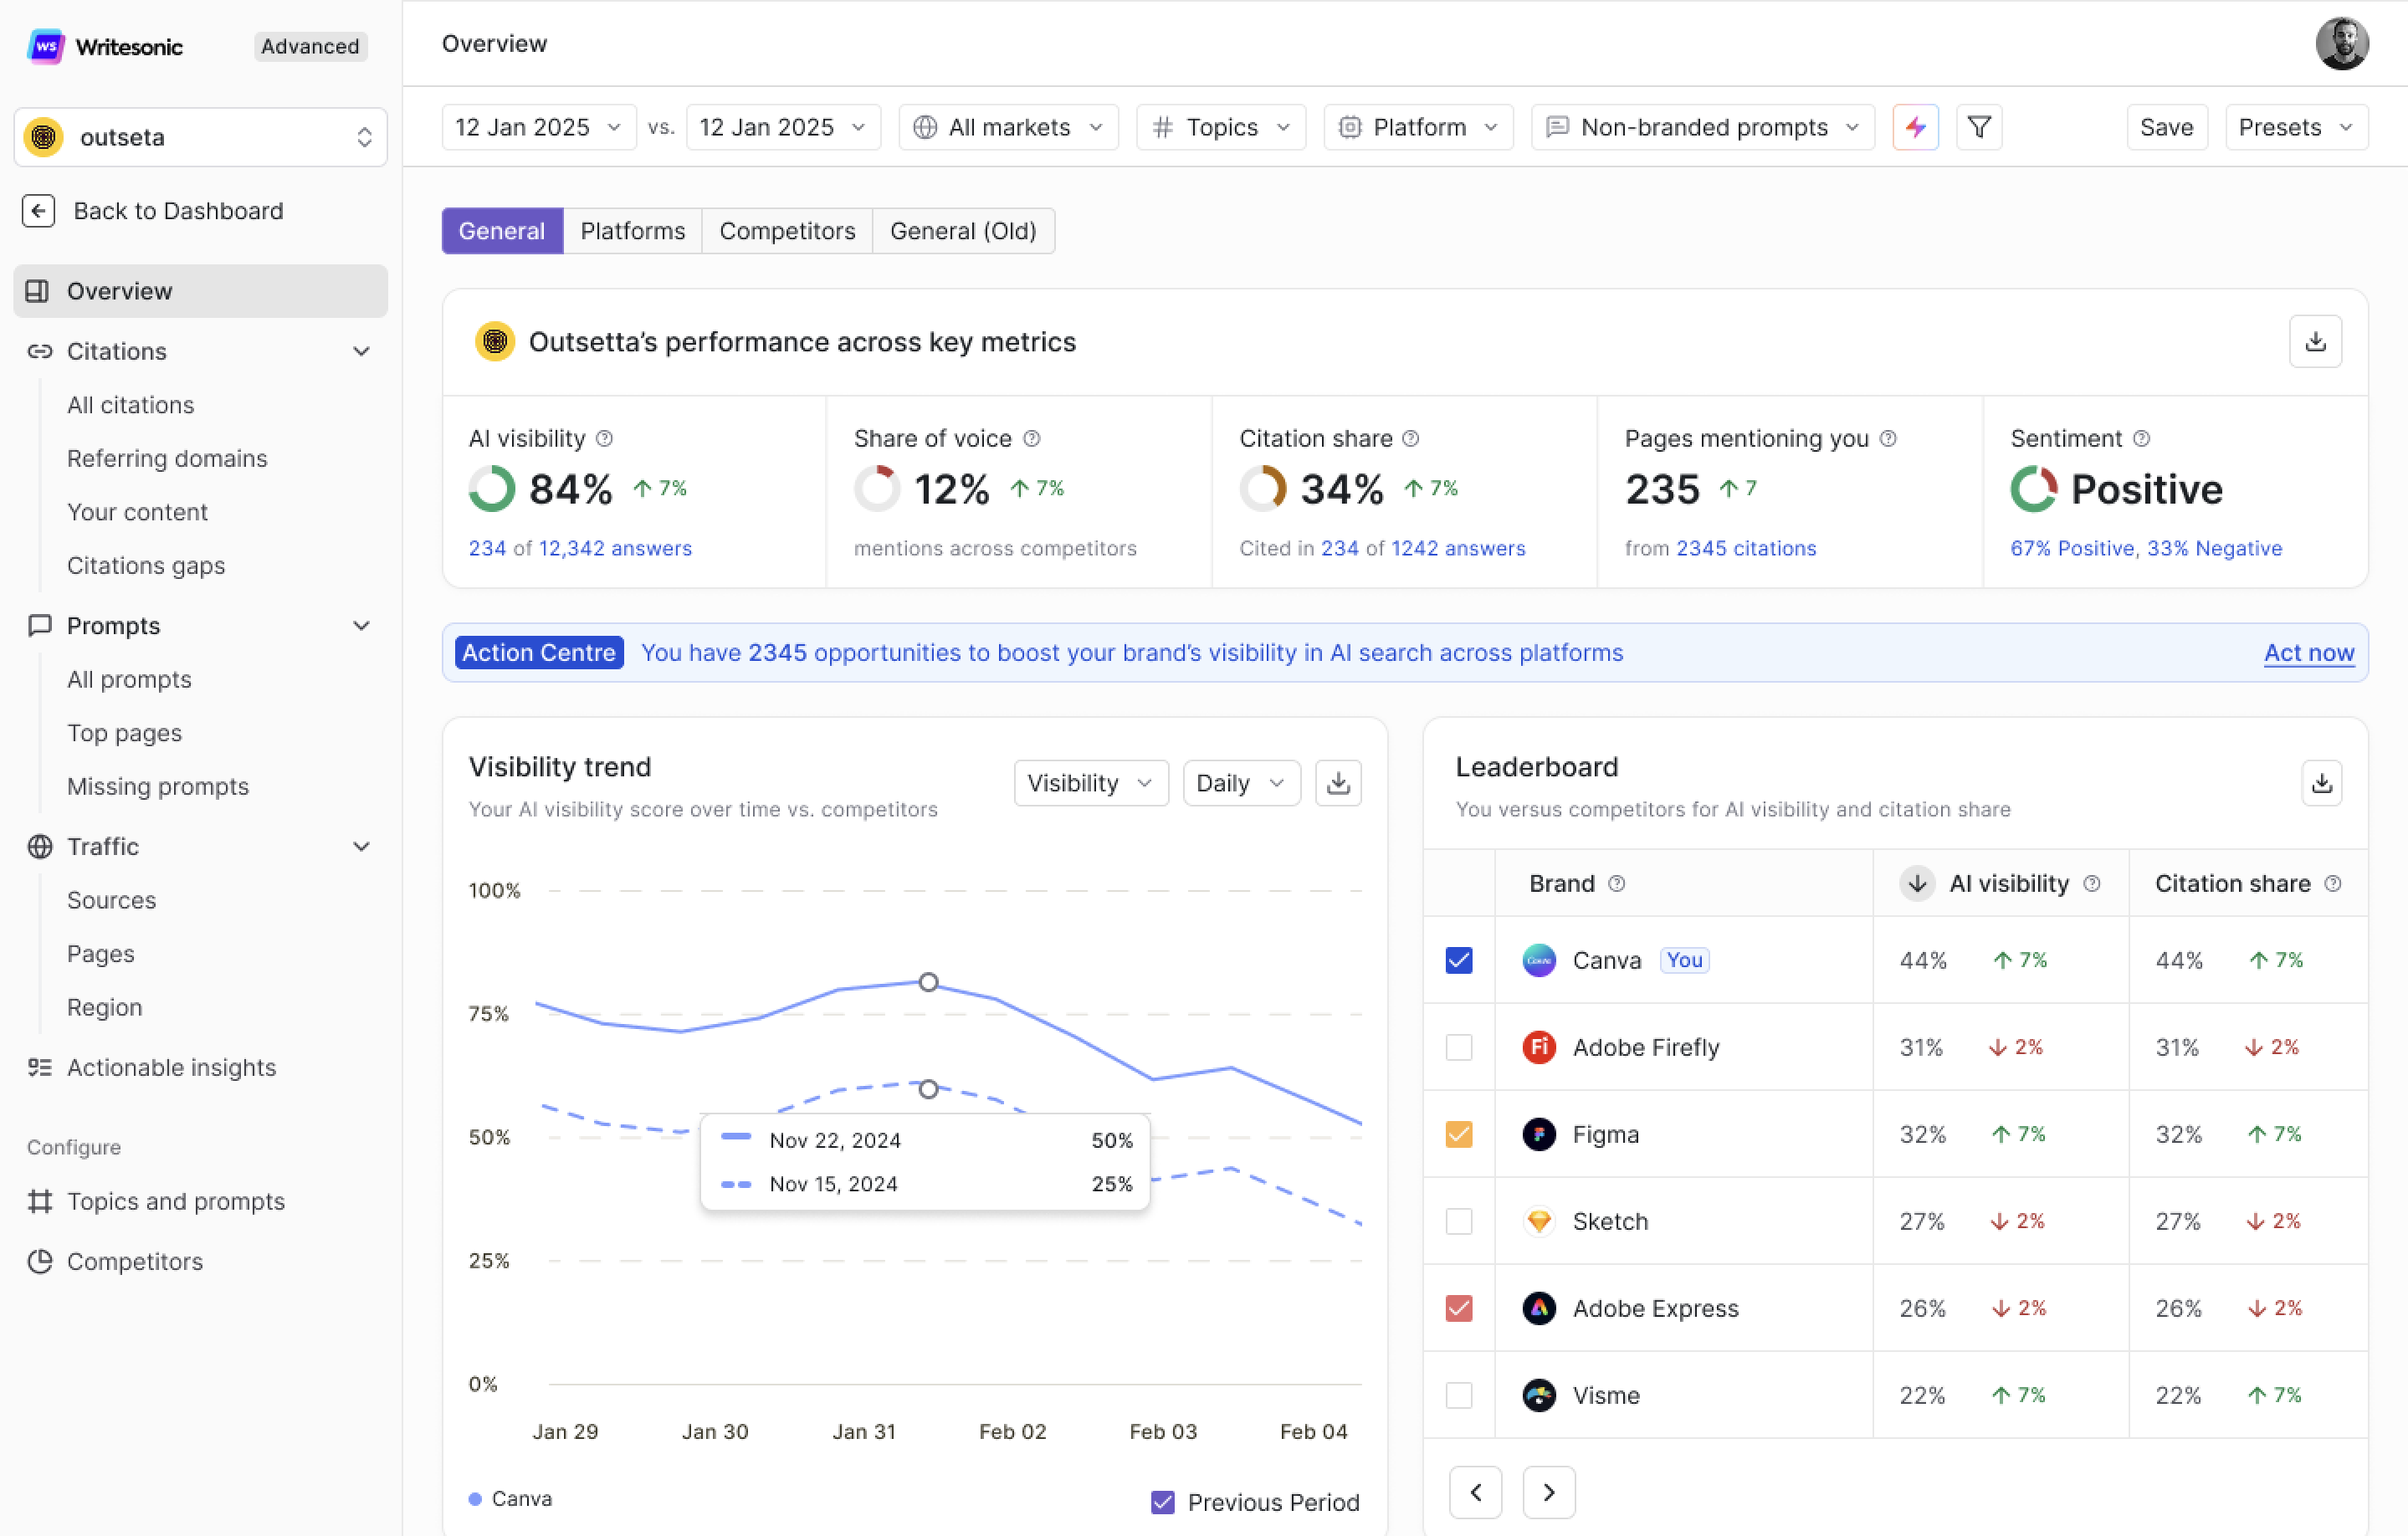
The Overview page is your central dashboard for understanding how your brand performs across AI-generated search results. It consolidates visibility, citations, competitor benchmarks, sentiment, and prompt-level data into one unified view — so you can quickly assess your brand's AI presence and identify where to take action.
This is the first page you see when you open your GEO project. It's designed for daily check-ins as well as strategic reporting — whether you're a marketer tracking weekly progress, an SEO manager benchmarking against competitors, or a leadership stakeholder reviewing high-level AI search performance.
The Overview page has four tabs: General, Platforms, Competitors, and General (Old). This document covers the General tab — the default and most comprehensive view.
Global Filters
The global filters bar sits at the top of the Overview page and controls the scope of data displayed across every section below. Adjusting any filter instantly updates all charts, tables, and metrics on the page.

- Date Range — Select a start and end date (e.g., 12 Jan 2025 – 12 Jan 2025) or use quick presets to define the reporting window. You can also enable a comparison period (vs.) to benchmark current performance against a previous time range.
- Markets — Filter by a specific market (country + language combination). Defaults to All markets. Useful if you track multiple regions within a single project.
- Topics — Narrow the dashboard to one or more specific topics you've configured. Helps you evaluate AI visibility per product line, category, or business unit.
- Platform — Isolate data for a single AI platform (e.g., ChatGPT, Perplexity, Gemini, Claude, Copilot). Defaults to all platforms combined.
- Prompt Type — Toggle between Branded prompts and Non-branded prompts to understand how your brand performs in generic industry queries versus queries that mention your brand directly.
- Save & Presets — Save any filter combination as a reusable preset for quick access during future sessions.
Your Brand's Performance Across Key Metrics
This section sits at the top of the General tab and provides a quick health check of your brand's AI presence. Each metric includes a trend indicator (↑ or ↓ with percentage) comparing the selected period against the prior period.
AI Visibility
The percentage of tracked AI-generated answers where your brand is mentioned — either by name or through a direct reference.
- This is your primary GEO metric. A rising visibility score means AI platforms are recognizing and surfacing your brand more frequently.
- The count below (e.g., "234 of 12,342 answers") shows raw mentions out of total tracked answers.
Share of Voice
Your brand's share of total mentions across all AI answers, relative to all tracked competitors.
- Think of this as your AI market share. It tells you how much of the generative search conversation belongs to your brand versus others in your space.
Citation Share
The percentage of all AI citations (source links in AI answers) that point to your website, versus competitor websites.
- Citations indicate trust and authority — when AI platforms link to your content as a source, it signals that your pages are considered reliable and reference-worthy.
- The count below (e.g., "Cited in 234 of 1,242 answers") provides the raw volume.
Pages Mentioning You
The number of third-party pages cited in AI answers that also mention your brand within their content.
- This reflects your off-site digital footprint — how often external sources talk about your brand in contexts that AI engines pull from.
- A higher count here means other authoritative sites are referencing you, which strengthens your chances of being surfaced in AI responses.
Sentiment
The overall tone — Positive, Neutral, or Negative — with which AI platforms describe your brand in their answers.
- Displayed as a percentage split (e.g., 67% Positive, 33% Negative) so you can track shifts in brand perception over time.
- Useful for catching reputation risks early and measuring the impact of PR or messaging changes.
Action Centre
Directly below the key metrics, the Action Centre banner shows the total number of available optimization opportunities to boost your brand's AI visibility.
- Click Act now to navigate to the full Action Centre, where recommendations are prioritized by impact level and effort required.
- Opportunities include actions like getting mentioned on high-authority third-party sites, optimizing existing content for AI readability, and closing citation gaps where competitors appear but your brand doesn't.
This is your fastest path from dashboard insight to concrete next steps.
Visibility Trend
The Visibility Trend chart tracks your brand's AI visibility score over time as a line graph, with the previous period overlaid for comparison.
- Metric Toggle — Switch between Visibility and Citation views using the dropdown above the chart.
- Granularity Toggle — Switch between Daily and Weekly views.
- Hover over any data point to see the exact percentage and date.
- The Previous Period line (muted color) lets you visually assess whether your visibility is trending upward, holding steady, or declining.
How to use it: This is where you measure the real-world impact of your GEO efforts. After publishing new content, running outreach, or optimizing pages, check the trend line over the following days and weeks to see if those actions moved the needle.
Leaderboard
The Leaderboard table ranks your brand alongside all tracked competitors on two core metrics:
- AI Visibility (%) — The percentage of AI answers mentioning each brand, with a trend indicator showing the period-over-period change.
- Citation Share (%) — The percentage of AI source citations each brand receives, with a trend indicator.
Your brand is highlighted (tagged as You) for easy identification. The table is sorted by AI visibility by default.
How to use it: The Leaderboard gives you instant competitive context. Identify who's ahead, who's gaining momentum, and where you need to close the gap. If a competitor's visibility is spiking, investigate their content or citation strategy to understand what's driving the change.
Platform-Wise Performance
This table breaks down your brand's AI Visibility and Citation Share by individual AI platform — including ChatGPT, Perplexity, Gemini, Copilot, LlamaAI, Claude, and others.
For each platform, you'll see:
- AI Visibility (%) — How frequently your brand appears in that platform's answers, plus the trend change.
- Citation Share (%) — How often that platform cites your content as a source, plus the trend change.
How to use it: Not all AI platforms behave the same way. You might have strong visibility on ChatGPT but be underperforming on Perplexity or Claude. This breakdown helps you pinpoint platform-specific weaknesses and prioritize optimization where it matters most.
Click View full report → to open the detailed Platforms tab for deeper platform-level analysis.
How AI Talks About Your Brand
This section displays a word cloud of the key positive and negative themes AI platforms associate with your brand across their responses.
- Larger, bolder words represent themes that appear more frequently.
- A mention count is shown (e.g., "Mentioned 123 times") so you can quantify the volume behind each theme.
- Themes can include product attributes (e.g., "User-Friendly Interface", "Robust Document Summarizer"), use cases (e.g., "Helpful for Academic Research"), or general perceptions (e.g., "Practical Tool", "Automatic Summarization").
How to use it: This gives you a qualitative lens on your AI brand perception. Beyond knowing if you're mentioned, this tells you how you're being described — which is critical for aligning your messaging, identifying unexpected brand associations, and spotting areas where perception doesn't match your positioning.
Share of Voice
The Share of Voice section visualizes your brand's percentage of total mentions in AI answers relative to competitors, displayed as a donut chart.
- Your brand and the top competitors are each shown with their respective share percentages.
- Your brand is labeled as You for quick identification.
How to use it: Share of voice is a leading indicator of brand dominance in AI search. A shrinking slice signals that competitors are gaining ground and you need to accelerate content and citation efforts. A growing slice validates that your GEO strategy is working.
Brand Rank Distribution
The "Which rank is your brand mentioned in answers" table shows the position at which your brand appears within AI-generated responses.
| Column | Description |
|---|---|
| Rank | The position at which your brand is mentioned (1st rank, 2nd rank, 3rd rank, 4th rank, 5th rank and more) |
| Percentage | The proportion of your total mentions that occur at each rank position |
| Answers | The absolute number of AI answers where your brand appeared at that rank |
How to use it: Being mentioned is valuable — being mentioned first is significantly more impactful. AI answers are consumed top-down, and the first brand referenced typically receives the most attention and trust. Track whether your 1st-rank percentage is growing over time; it's a strong signal of improving brand authority in AI responses.
Your Top Cited Content
This table lists the specific pages from your website that are most frequently cited as sources in AI-generated answers.
For each page, you'll see:
- Cited Page — The URL and page title being referenced by AI platforms.
- Citation Share (%) — The percentage of total citations this page accounts for, with a trend indicator.
- Citing Answers — The number of AI answers that cite this specific page, with period-over-period change.
How to use it: Your top cited pages are your highest-performing AI assets. These are the pages that AI engines trust enough to link back to as sources. Keep them updated, comprehensive, and authoritative — they're directly fueling your brand's citation share and overall AI visibility.
Click Show all webpages → to view the full list of cited content.
Most-Searched Prompts by Users
This section surfaces the most popular prompts (user queries) relevant to your brand and industry, ranked by search volume.
For each prompt, you'll see:
- Prompt — The actual question or query users are asking AI platforms.
- Search Volume — An estimate of how frequently this prompt is searched.
- AI Visibility (%) — The percentage of AI answers for this prompt that mention your brand, with trend direction.
- Answers — The total number of AI-generated answers tracked for this prompt, with the change from the prior period.
How to use it: High search volume + low AI visibility = your biggest growth opportunity. These are the conversations your audience is having with AI engines where your brand isn't showing up yet. Prioritize creating or optimizing content that directly addresses these prompts.
Click Show all popular prompts → to explore the full prompt list.
Your Brand Visibility Across Prompts
This table provides a prompt-level breakdown of your brand's visibility, with two tabs:
- Mentions you — Prompts where your brand is mentioned in AI answers.
- Does not mention you — Prompts where your brand is absent from AI answers.
For each prompt, you'll see:
- Prompt — The tracked query.
- Search Volume — How often it's searched.
- AI Visibility (%) — Your visibility for that specific prompt, with trend direction.
- Answers — The number of AI answers tracked, with period-over-period change.
How to use it: The "Does not mention you" tab is especially powerful — it reveals the exact conversations happening in AI search where your brand is currently invisible. These are your highest-priority targets for content creation, optimization, and outreach. Cross-reference these with the Action Centre recommendations for a clear execution path.
Click Show all prompts driving visibility → to access the complete prompt-level breakdown.
Updated 5 months ago