Sentiment: Overview
The Sentiment: Overview page is your central hub for understanding how AI search engines perceive and talk about your brand. It aggregates sentiment data from AI-generated responses across platforms like ChatGPT, Perplexity, Claude, Google AI Overviews, and others — giving you a clear picture of whether your brand is being described positively or negatively when it appears in AI answers.
Think of it this way: visibility tells you _if your brand is mentioned, but sentiment tells you _how it's mentioned. A brand that's frequently mentioned but in a negative light may actually be worse off than one with fewer but positive mentions. This page helps you monitor, measure, and act on that distinction.
Who Is This Page For?
- Marketing & Brand teams who want to monitor public perception of their brand in AI-generated content.
- SEO & GEO specialists tracking how sentiment shifts correlate with content updates and optimization efforts.
- Enterprise teams managing reputation across multiple markets, platforms, and product lines.
- Executives & stakeholders who need a quick, high-level read on brand health in the AI search landscape.
Page-Level Filters
Before diving into the data, you can refine what you see using filters at the top of the page:

- Date range selector — Choose and compare two time periods (e.g., 12 Jan 2025 vs. 12 Jan 2025) to track how sentiment has shifted over time.
- Markets — Filter by the geographic region/market you're tracking (e.g., All markets or a specific country).
- Topics — Narrow down to specific topics configured during your GEO setup.
- Platform — View sentiment from a specific AI platform (e.g., ChatGPT, Perplexity, Google AI Overviews) or across all platforms.
- Tags — Apply custom tags to segment and filter your sentiment data further.
These filters let you isolate exactly the data you need — whether you're looking at a specific market, a particular AI platform, or a narrow topic area.
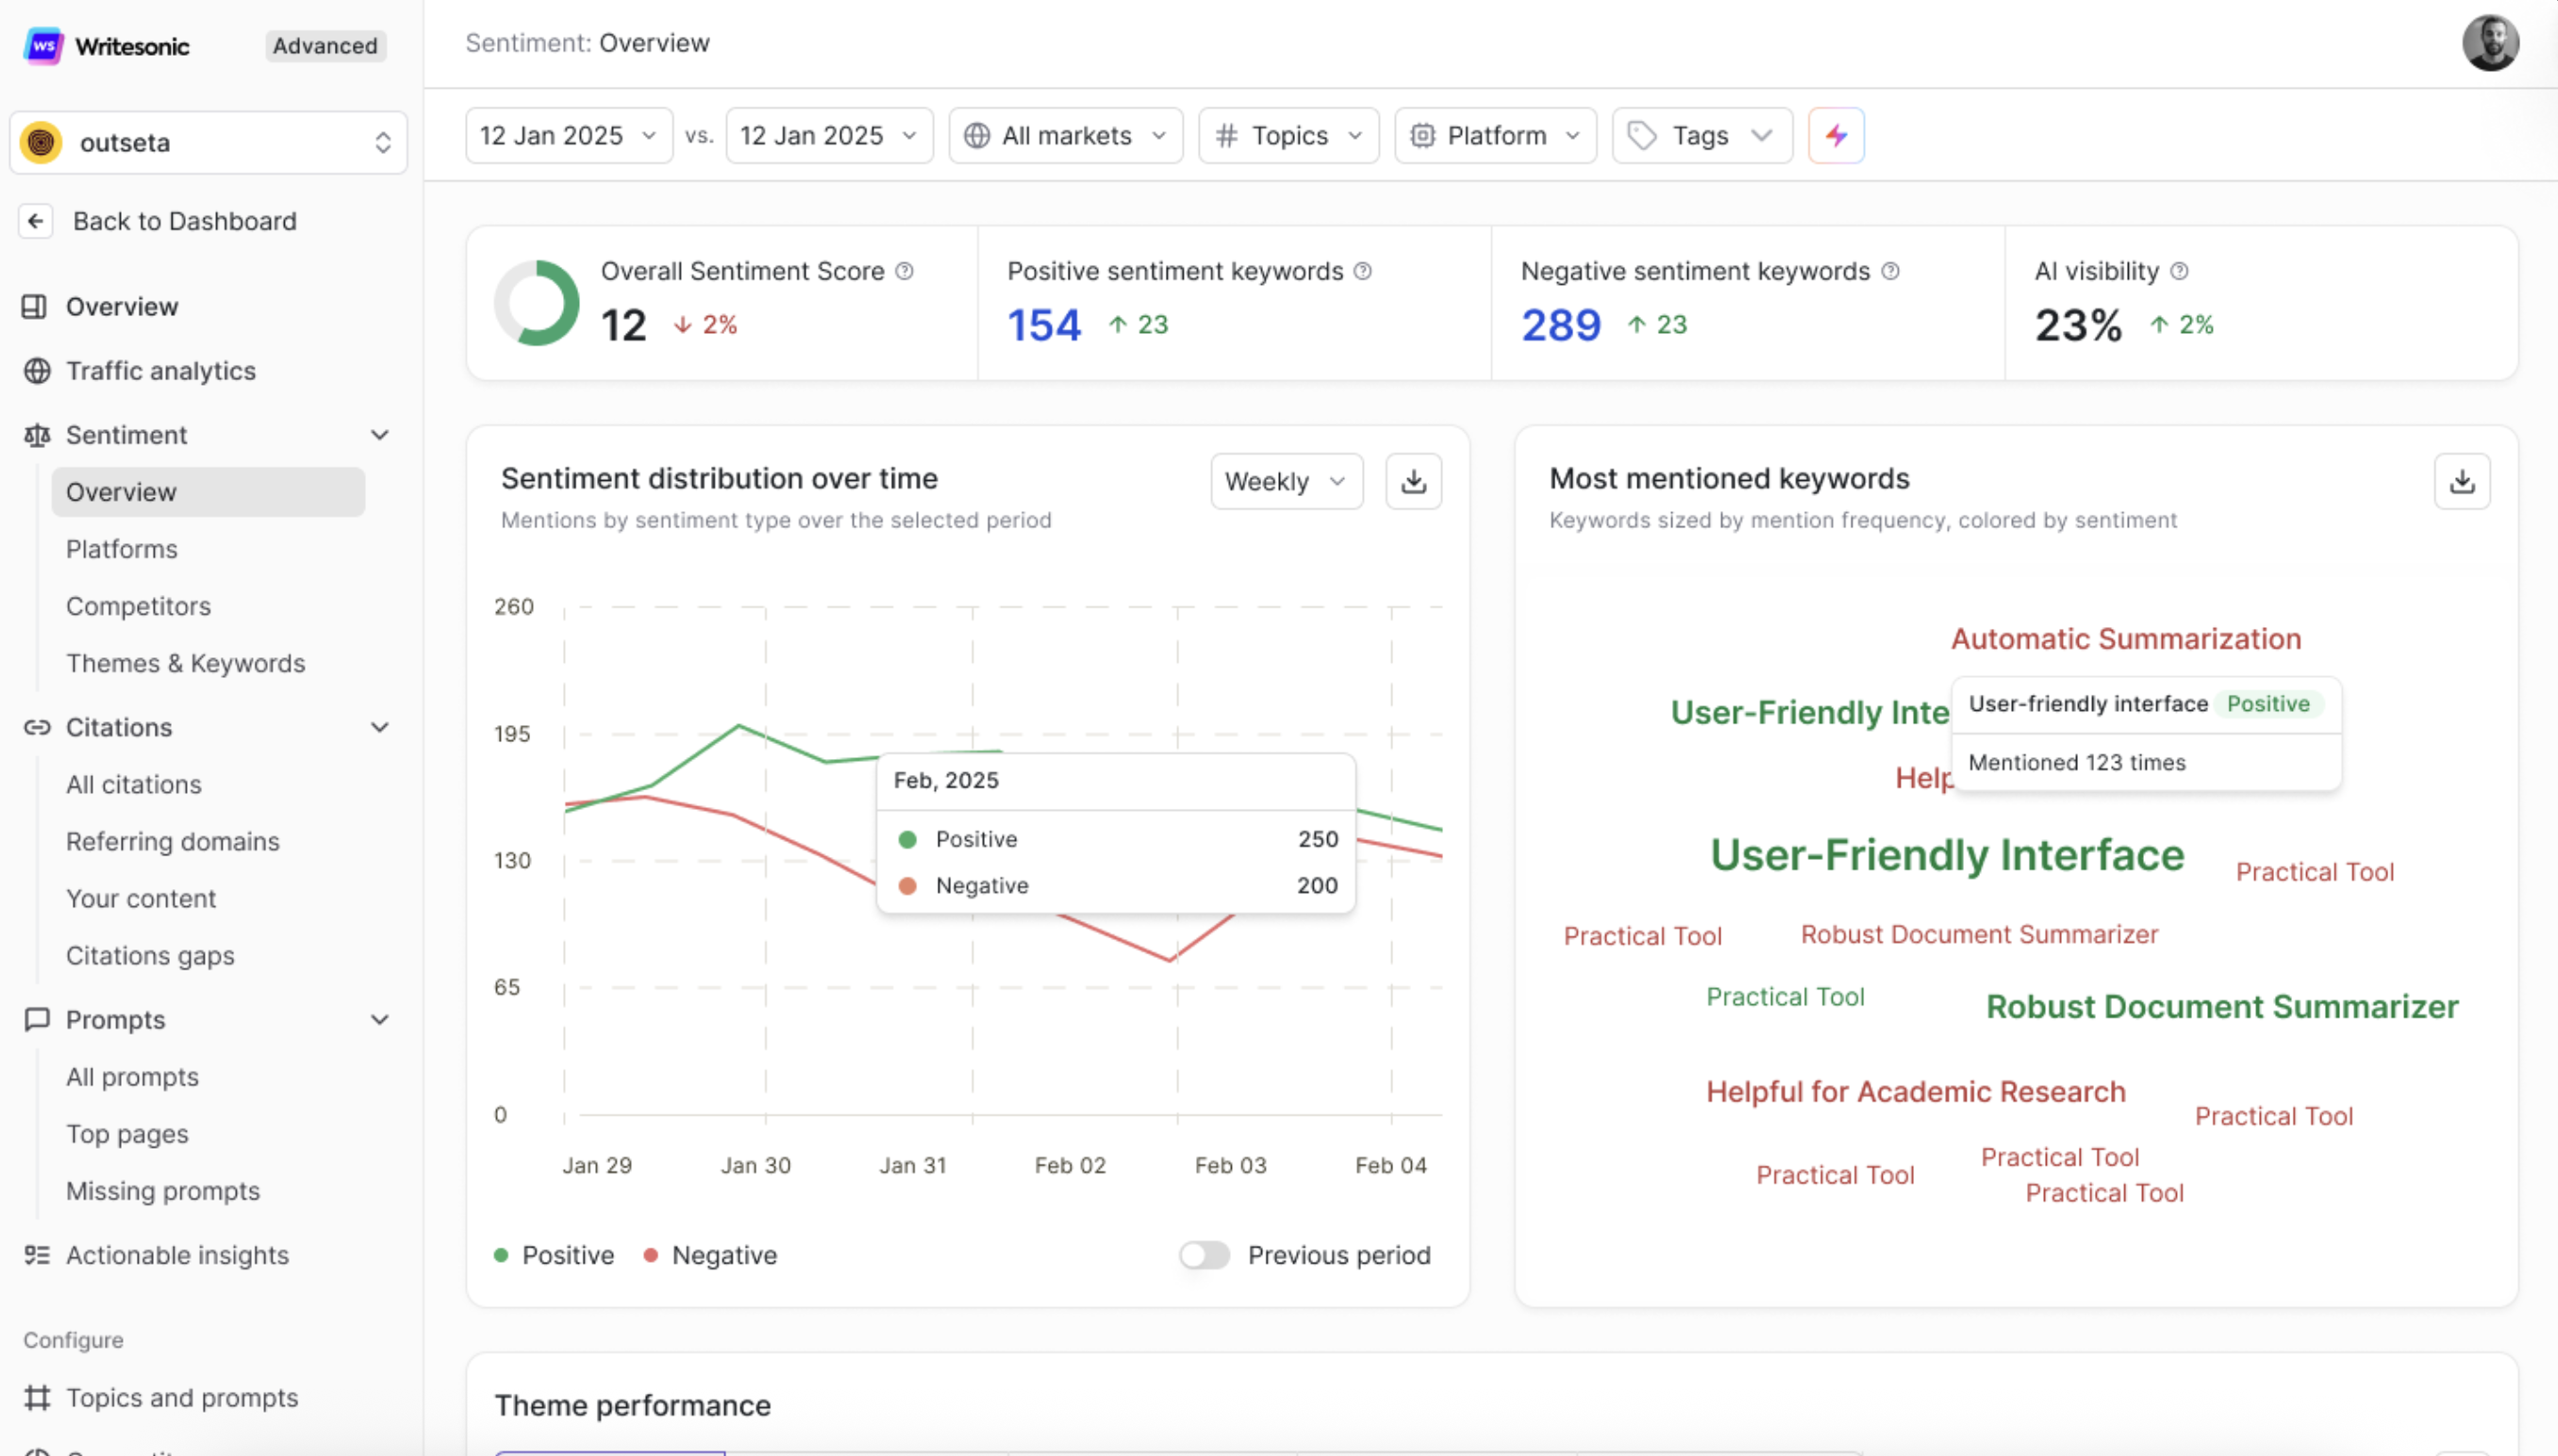
Key Metrics (Summary Cards)
At the top of the page, you'll see four high-level metrics that give you an instant snapshot of your brand's sentiment health:

Overall Sentiment Score
A single numeric score that represents the net sentiment of your brand across all tracked AI answers. This score accounts for both positive and negative mentions and provides a quick health check.
- A higher score means AI platforms are describing your brand more favorably.
- A declining score (indicated by a red percentage change) signals that negative mentions may be increasing or positive ones are dropping.
- Use this as your primary sentiment KPI when reporting to stakeholders.
Positive Sentiment Keywords
The total count of keywords associated with positive sentiment about your brand. These are the terms AI engines are using in a favorable context when mentioning your brand.
- An upward trend here means AI platforms are associating more positive language with your brand.
- Monitor this alongside your content and PR efforts to see what's driving positive perception.
Negative Sentiment Keywords
The total count of keywords tied to negative sentiment. These keywords appear in AI responses where your brand is discussed in a less favorable or critical tone.
- An increasing count here is a signal to investigate which themes or topics are driving negativity.
- Cross-reference with the Theme Performance section (below) to pinpoint specific problem areas.
AI Visibility
Your brand's overall AI visibility percentage — the share of tracked AI responses that mention your brand. While not exclusively a sentiment metric, it provides critical context: sentiment data is only meaningful if your brand has enough visibility for it to matter.
- A rising visibility paired with positive sentiment is the ideal scenario.
- Rising visibility with increasing negative sentiment needs immediate attention — more people are seeing unfavorable mentions.
Sentiment Distribution Over Time
This chart visualizes how positive and negative mentions trend across your selected date range. It displays sentiment volume on a weekly (or custom) basis, allowing you to spot patterns, spikes, and dips.
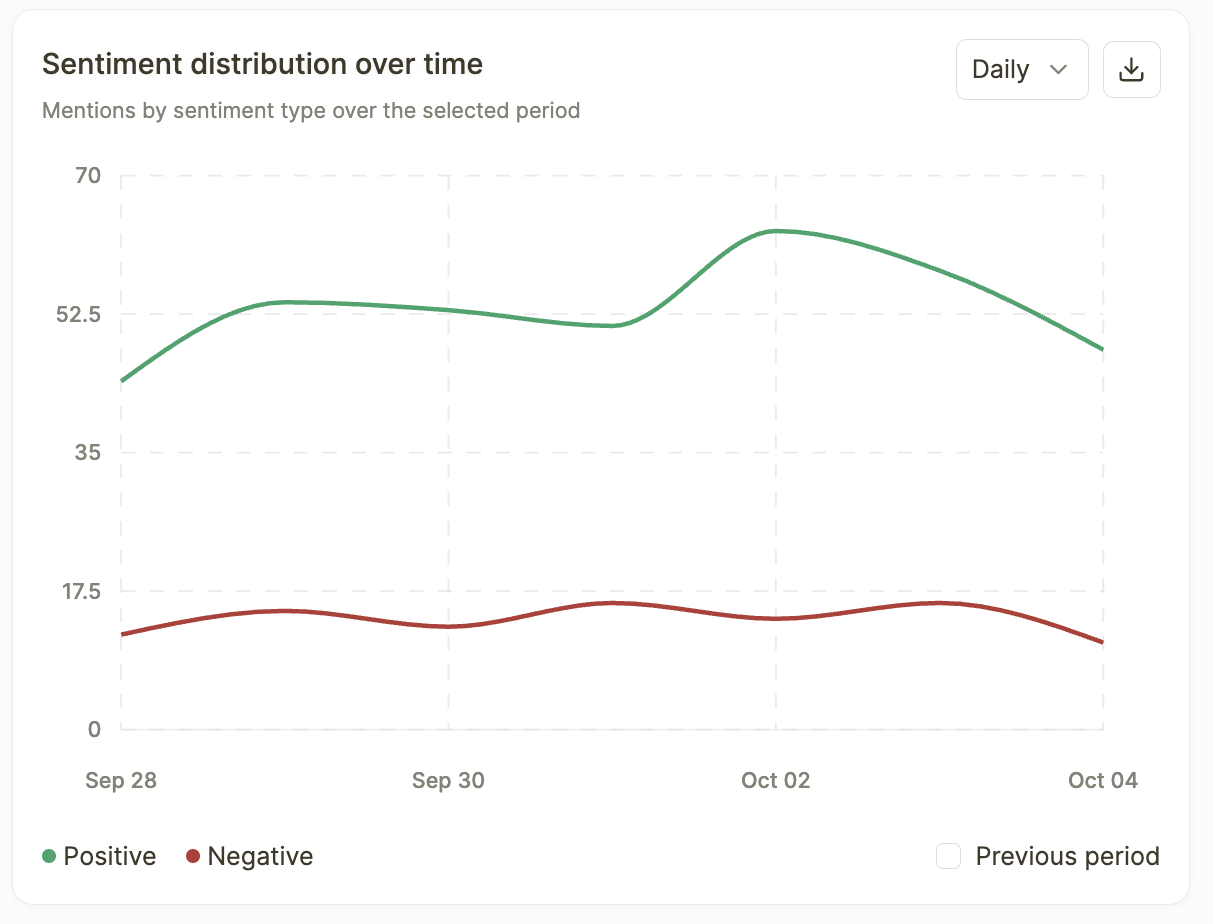
What to look for:
- Consistent green (positive) above red (negative) — Healthy brand perception. AI platforms are talking about you favorably.
- Spikes in negative sentiment — Could indicate a product issue, a competitor campaign, or negative press that AI engines have picked up.
- Crossover points — When negative sentiment overtakes positive, this is a critical moment that warrants investigation.
- Previous period comparison toggle — Enable this to overlay a prior time period and see how sentiment has improved or declined.
How to use it:
- Correlate sentiment shifts with your own marketing activities, product launches, or industry events.
- If you see a spike in negative sentiment, drill down into the Theme Performance table (below) to identify which specific themes are driving it.
- Export the chart data using the download icon for use in reports or presentations.
Most Mentioned Keywords
A word cloud that visualizes the keywords most frequently associated with your brand across AI responses, sized by mention frequency and colored by sentiment.
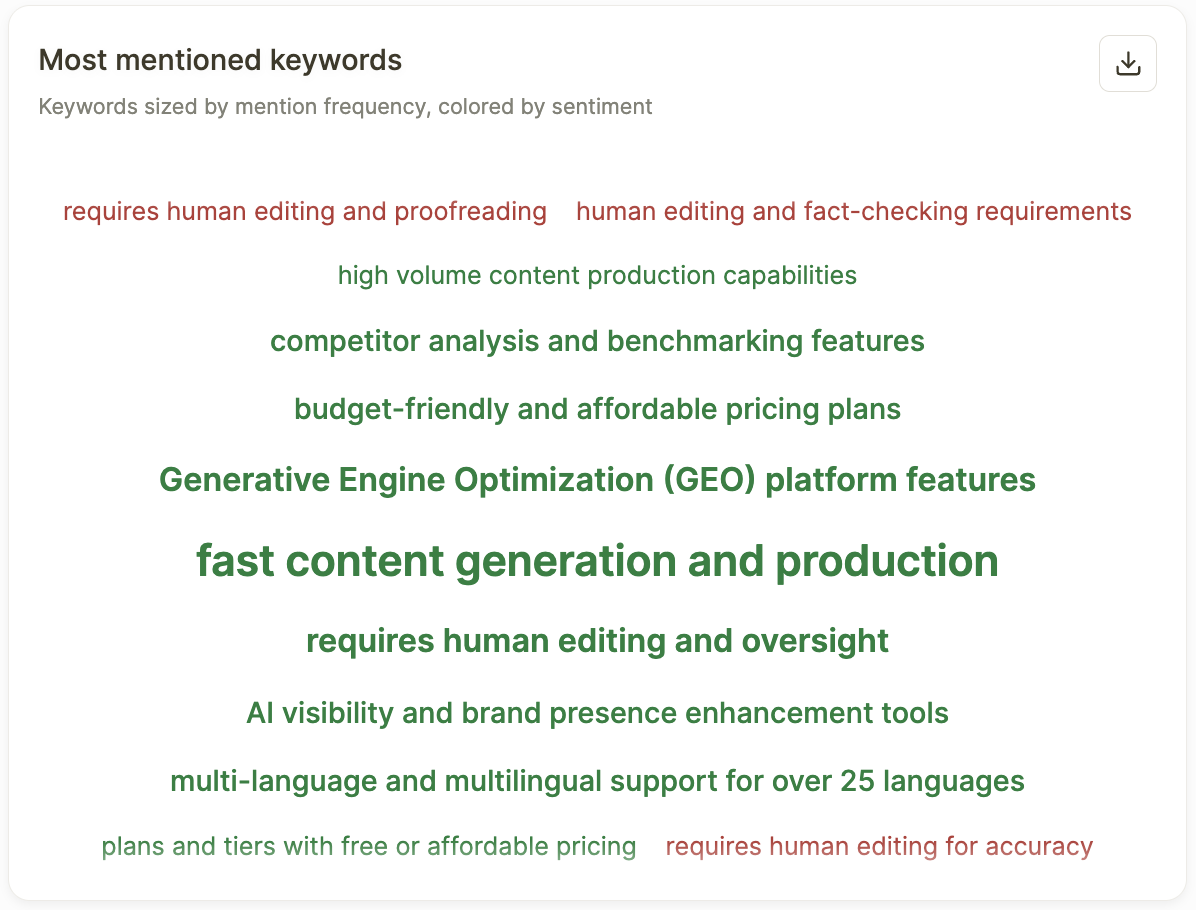
How it works:
- Larger keywords appear more frequently in AI-generated answers about your brand.
- Color coding indicates sentiment — keywords in positive sentiment are visually distinguished from those in negative sentiment.
- Hover over any keyword to see the exact mention count and its sentiment classification (e.g., "User-friendly interface — Positive — Mentioned 123 times").
Why it matters:
- Quickly identify the dominant narratives AI engines are building around your brand.
- Spot emerging keywords — new terms appearing in the cloud may signal shifting perception.
- If negative keywords are growing larger (more frequent), it's a sign you need to address the underlying issues in your content or product experience.
Theme Performance
The Theme Performance section is the most actionable part of the Sentiment Overview page. It breaks down your brand's sentiment into recurring themes — the topics and patterns that AI platforms consistently associate with your brand.
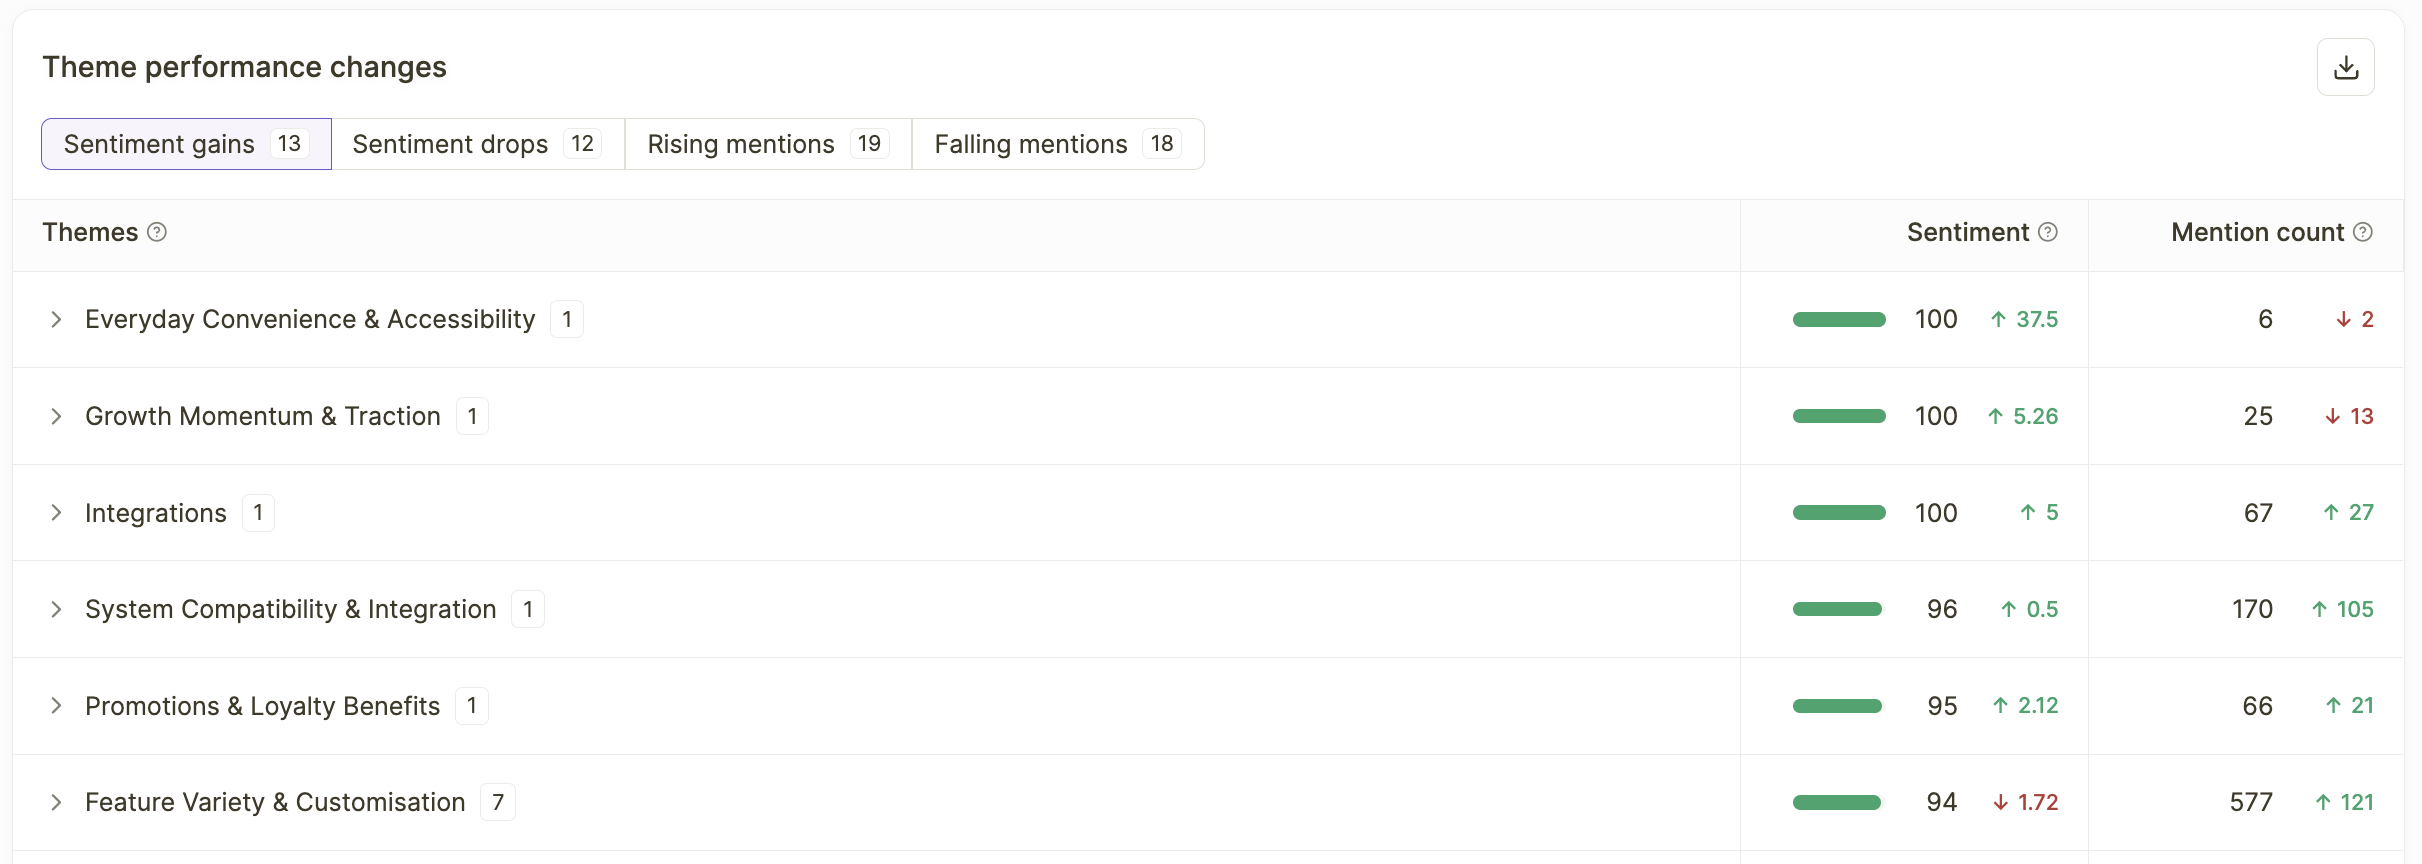
Tab Navigation
The section is organized into five tabs, each showing a count of themes:
- Top Themes — The most frequently mentioned themes across all AI responses. These represent the core narratives AI engines are building around your brand.
- Sentiment Gains — Themes where positive sentiment has increased compared to the previous period. These are your wins.
- Sentiment Drops — Themes where sentiment has declined. These need attention and potentially a targeted content or messaging response.
- Rising Mentions — Themes that are being mentioned more frequently, regardless of sentiment. Useful for spotting trending topics.
- Falling Mentions — Themes that are losing traction in AI responses. Could indicate decreasing relevance or shifting AI platform focus.
Theme Table
Each theme in the table includes:
- Theme name — The specific topic or pattern (e.g., Intuitive user interface, Responsive design, Seamless integration).
- Sentiment score — A numeric score with a visual bar showing the positive-to-negative ratio. Higher scores (with green bars) indicate more positive sentiment; lower scores (with red indicators) signal predominantly negative sentiment.
- Sentiment change indicator — An arrow showing whether sentiment has improved (↑) or declined since the previous period.
- Mention count — How many times this theme appeared in AI responses during the selected period.
- Mention change indicator — An arrow showing whether mentions are increasing (↑) or decreasing (↓) compared to the prior period.
Expandable Sub-Themes
Click the expand arrow (>) next to any theme to reveal its sub-themes — the specific keywords and phrases that make up that broader theme. Each sub-theme shows its own sentiment score and mention count, giving you granular visibility into what's driving the overall theme's performance.
For example, expanding "Seamless integration" might reveal sub-themes like:
- User-friendly interface
- Quick load times
- Comprehensive documentation
- Frequent updates
This drill-down helps you understand not just what AI is saying, but the specific attributes driving positive or negative perception.
How to Use Theme Performance
- Prioritize themes with high mentions and declining sentiment — These are high-impact areas where negative perception is spreading at scale.
- Double down on themes with sentiment gains — Identify what you're doing right and amplify it in your content strategy.
- Investigate rising mentions with low sentiment scores — A theme gaining traction for the wrong reasons needs a swift content or messaging response.
- Use falling mentions as a signal — If a previously strong theme is losing mentions, refresh the associated content to keep it relevant.
Best Practices for Using Sentiment: Overview
- Check weekly. Sentiment shifts can happen fast, especially after product updates, PR events, or competitor activity. A weekly review cadence helps you catch changes early.
- Pair sentiment with visibility. A sentiment score in isolation doesn't tell the full story. Always consider it alongside your AI visibility metrics — high visibility with poor sentiment is more damaging than low visibility.
- Use filters strategically. Don't just look at the aggregate. Filter by platform to see if sentiment issues are platform-specific (e.g., poor sentiment on ChatGPT but positive on Perplexity). Filter by topic to isolate which product areas are driving negative perception.
- Act on Theme Performance. The theme table is your most actionable tool. Use it to brief content teams, inform product messaging, and identify specific areas for improvement.
- Export and share. Use the download icons on charts and tables to pull data into reports and presentations for stakeholders.
Updated 5 months ago