Dashboard
Dashboard Overview
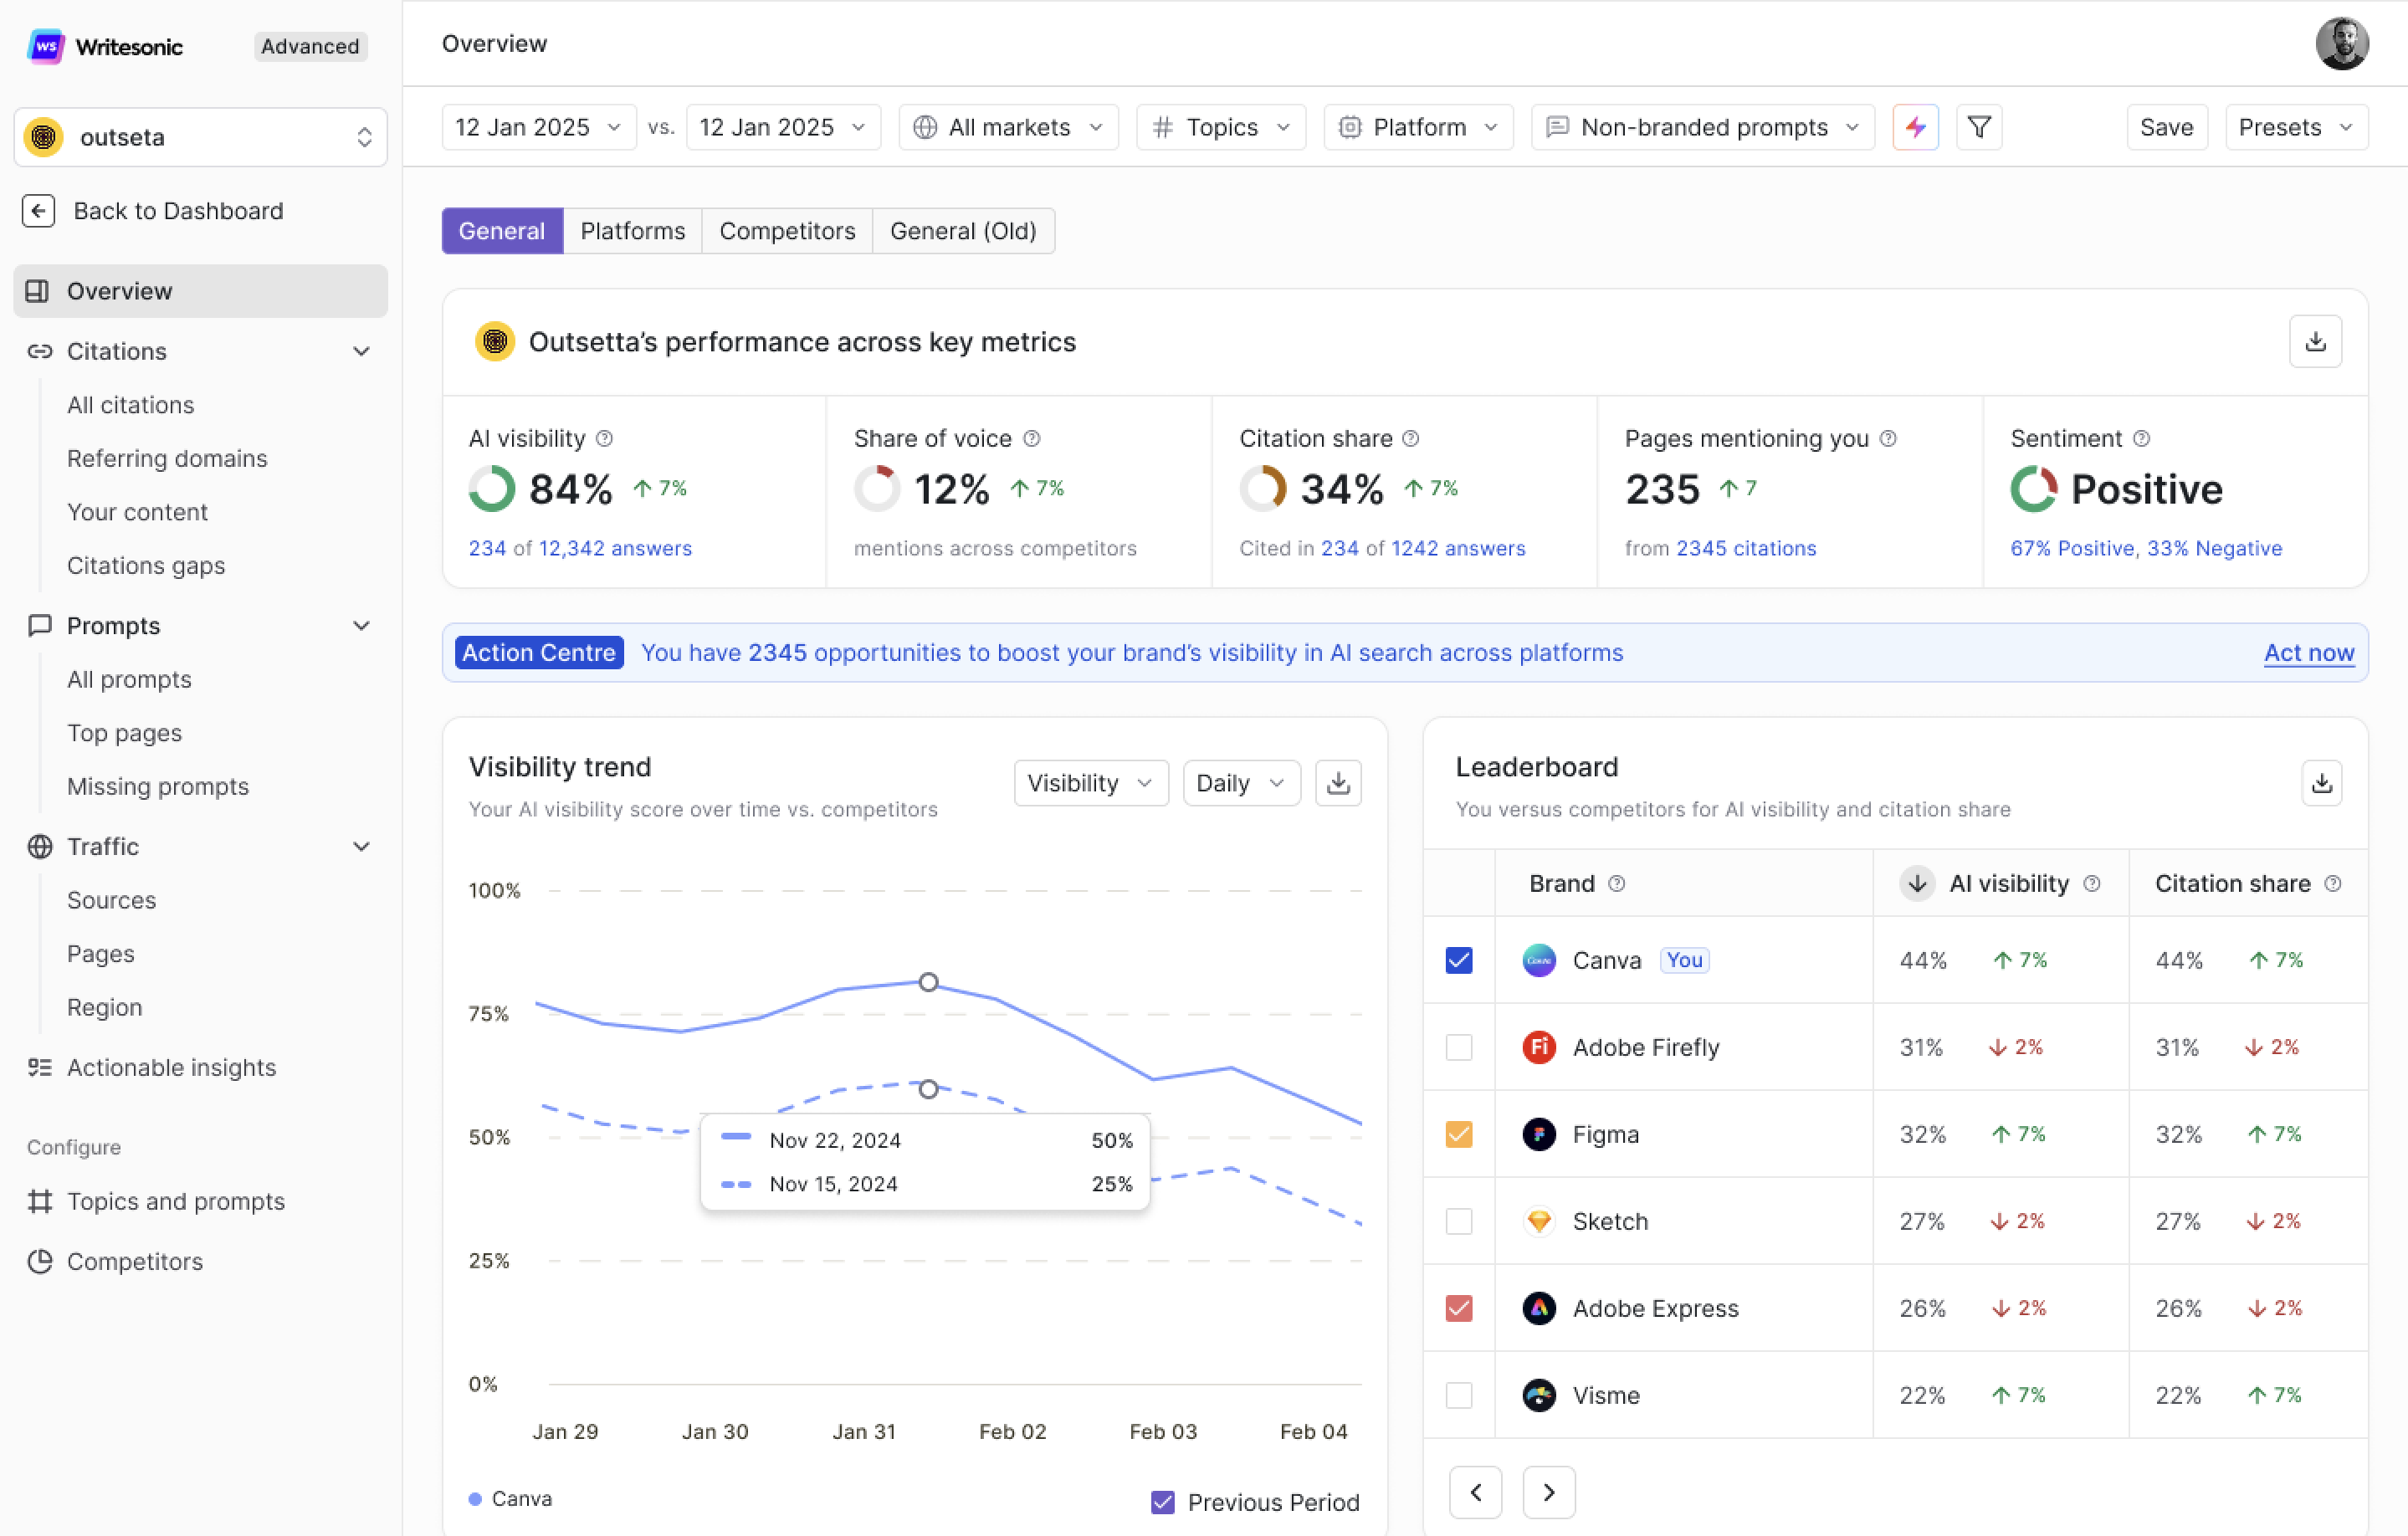
The Overview page is your central dashboard for tracking how your brand performs across AI-generated search results. It consolidates visibility, citations, competitor benchmarks, sentiment, and prompt-level data into a single view — giving you a quick read on where your brand stands and where to take action.
This is the first page you see when you open your GEO project. The Overview page has four tabs: General, Platforms, Competitors, and General (Old). This document covers the General tab.
Global Filters
The filters bar at the top controls the scope of data across every section on the page.
- Date Range — Define the reporting window with a start/end date or quick presets. Enable a comparison period (vs.) to benchmark against a previous range.
- Markets — Filter by country + language combination. Defaults to All markets.
- Topics — Narrow results to specific topics you're tracking.
- Platform — Isolate data for a specific AI platform (e.g., ChatGPT, Perplexity, Gemini, Claude, Copilot).
- Prompt Type — Toggle between Branded and Non-branded prompts.
- Save & Presets — Save filter combinations for quick reuse.
Your Brand's Performance Across Key Metrics
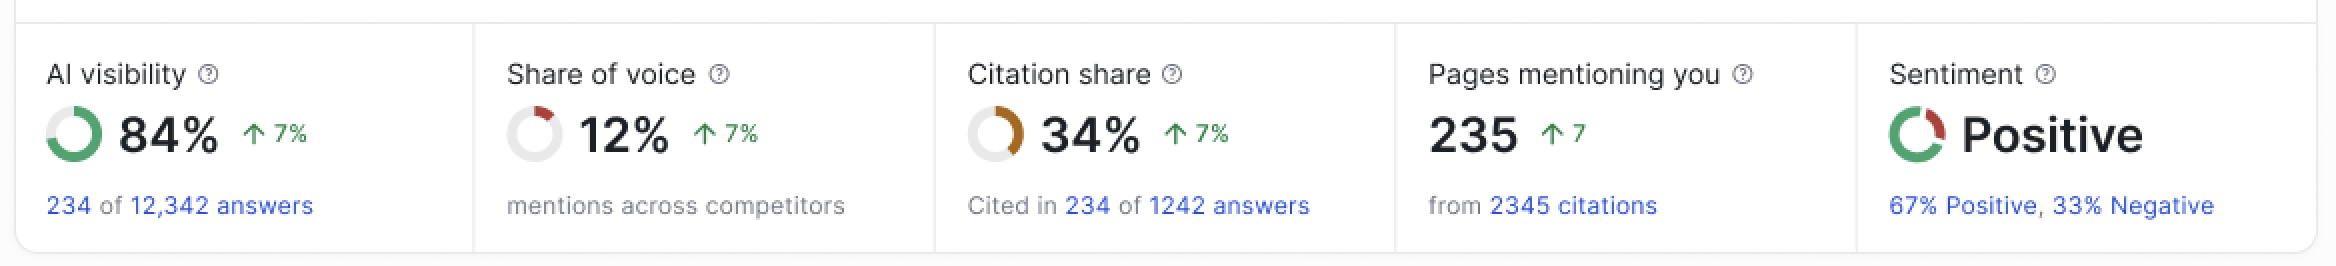
A top-level row of metrics providing a quick health check. Each includes a trend indicator comparing the current period to the prior one.
- AI Visibility — Percentage of tracked AI answers where your brand is mentioned. This is your primary GEO metric. The count below shows raw mentions out of total tracked answers.
- Share of Voice — Your brand's share of total mentions relative to tracked competitors — essentially your AI market share.
- Citation Share — Percentage of all AI source citations pointing to your website versus competitors. Citations signal trust and authority.
- Pages Mentioning You — Number of third-party pages cited in AI answers that also mention your brand. Reflects your off-site digital footprint.
- Sentiment — Overall tone (Positive, Neutral, Negative) with which AI platforms describe your brand, shown as a percentage split.
Action Centre
A banner below the key metrics showing the total number of optimization opportunities available. Click Act now to access prioritized recommendations — ranked by impact and effort — to start closing visibility gaps immediately.
Visibility Trend
A line chart tracking your AI visibility score over time, with the previous period overlaid for comparison.
- Toggle between Visibility and Citation metrics via the dropdown.
- Switch between Daily and Weekly granularity.
- Hover over any data point for exact values.
Use this to measure the real-world impact of your GEO efforts over days and weeks.
Leaderboard
Ranks your brand against all tracked competitors on two metrics:
- AI Visibility (%) — Percentage of AI answers mentioning each brand.
- Citation Share (%) — Percentage of AI source citations each brand receives.
Your brand is tagged as You for easy identification. Each row includes trend indicators. Use it to see who's ahead, who's gaining momentum, and where you need to close the gap.
Platform-Wise Performance
Breaks down AI Visibility and Citation Share by individual AI platform — ChatGPT, Perplexity, Gemini, Copilot, LlamaAI, Claude, and others. Each row shows the metric percentage plus period-over-period change.
Not all platforms behave the same way — use this to pinpoint platform-specific gaps and tailor your strategy accordingly.
Click View full report → to open the detailed Platforms tab.
How AI Talks About Your Brand
A word cloud of key themes AI platforms associate with your brand. Larger words appear more frequently. Includes a mention count (e.g., "Mentioned 123 times") for volume context.
Themes range from product attributes (e.g., "User-Friendly Interface") to use cases (e.g., "Helpful for Academic Research"). This tells you not just if you're mentioned, but how you're being described — critical for brand positioning.
Share of Voice
A donut chart showing your brand's percentage of total AI mentions versus competitors. Your brand is labeled You. A shrinking slice signals competitors are gaining ground; a growing slice validates your GEO strategy.
Brand Rank Distribution
Shows the position at which your brand appears within AI answers (1st rank through 5th rank and more). For each rank, you'll see:
- Percentage — Proportion of your mentions at that rank.
- Answers — Absolute number of AI answers at that position.
Being mentioned first is significantly more impactful — AI answers are consumed top-down, and the first brand referenced gets the most attention.
Your Top Cited Content
Lists the specific pages from your website most frequently cited as sources in AI answers. For each page:
- Cited Page — URL and page title.
- Citation Share (%) — Percentage of total citations, with trend.
- Citing Answers — Number of AI answers citing this page, with period-over-period change.
These are your highest-performing AI assets — keep them updated and authoritative.
Click Show all webpages → for the full list.
Most-Searched Prompts by Users
Surfaces the most popular prompts relevant to your brand, ranked by search volume. For each prompt:
- Search Volume — How frequently it's searched.
- AI Visibility (%) — Your visibility for this prompt, with trend.
- Answers — Total AI answers tracked, with change.
High search volume + low visibility = your biggest growth opportunity.
Click Show all popular prompts → to explore the full list.
Your Brand Visibility Across Prompts
A prompt-level breakdown with two tabs:
- Mentions you — Prompts where your brand appears in AI answers.
- Does not mention you — Prompts where your brand is absent.
Each row shows the prompt, search volume, AI visibility %, and answer count. The "Does not mention you" tab reveals the exact conversations your brand is missing from — your highest-priority targets for content and outreach.
Click Show all prompts driving visibility → for the complete breakdown.
Updated 5 months ago